
EUR/CAD – 1.4700
Although the single currency edged higher to 1.439 last week, the subsequent retreat suggests consolidation below this level would be seen and weakness to 1.4635 support cannot be ruled out, however, a daily close below there is needed to suggest the rebound from 1.4441 has ended there, bring further fall to 1.4550-55 and later towards support at 1.4488. Looking ahead, euro needs to penetrate this support to revive bearishness and signal early erratic decline from 1.5259 top has resumed for retest of 1.4441. An drop below this level would extend the fall from 1.5259 to 1.4400 and possibly towards 1.4345-50 (61.8% Fibonacci retracement of 1.3784-1.5259), however, reckon downside would be limited to 1.4290-95 (100% projection of 1.5259-1.4478 measuring from 1.5076) and 1.4190-00 should hold, price should stay above 1.4110-15 (1.236 times projection), bring rebound later.
Our latest preferred count is that larger degree wave [C] from 1.3289 as well as circle wave B ended at 1.7509 in Dec 2008 with (A): 1.6325, (B): 1.4719 followed by wave (C) at 1.7509, hence circle wave C is unfolding with wave 1 ended at 1.5186 (diagonal wave 1), wave 2 at 1.6096, impulsive wave 3 has ended at 1.2451, followed by wave 4 at 1.4380, in view of recent strong rebound, we are now treating the wave 5 as well as larger degree circle wave C has ended at 1.2129, hence (A)-(B)-(C) correction has commenced from there with impulsive wave (C) now unfolding and indicated initial upside target at 1.6000 had been met and reckon 1.6500 would hold.
On the upside, whilst initial recovery to 1.4750-60 cannot be ruled out, reckon upside would be limited and said resistance at 1.4839 should hold, bring another retreat. Above said resistance would signal the rebound from 1.4441 is still in progress for further gain too 1.4900, having said that, price should falter below 1.5000 and bring another decline later.
Recommendation: Stand aside for tis week.
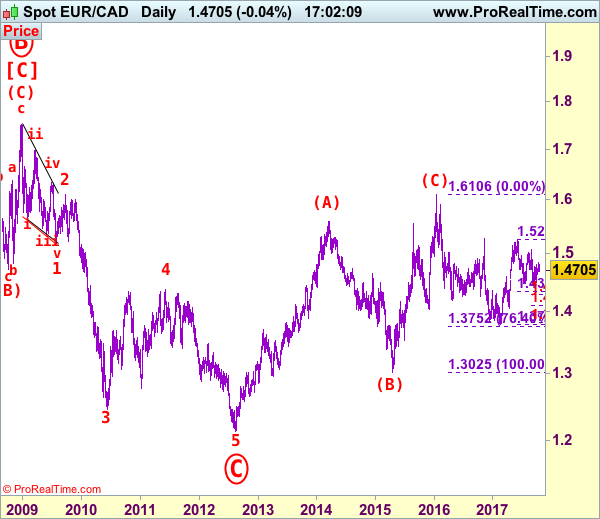
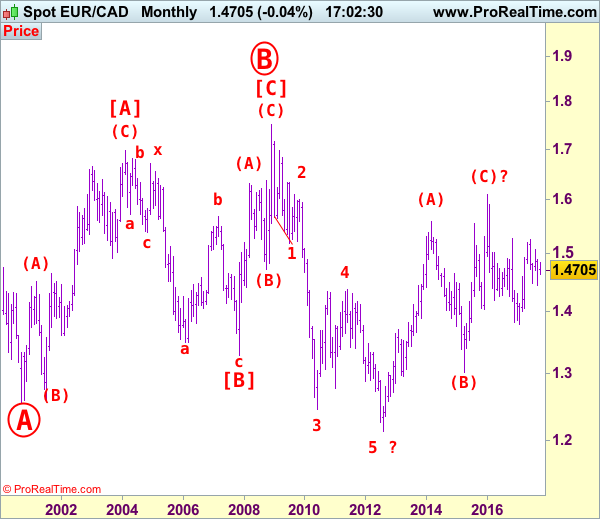
On the bigger picture, our long-term count on the monthly chart is that a big sideways consolidation from 2000 low of 1.2557 has possibly ended at 1.7509 as circle wave B with [A]: 1.6976 ( (A): 1.4513, (B): 1.2612, (C): 1.6976), wave [B]: 1.3289 is a double three with 1st a-b-c: 1.5384, x: 1.6709 and 2nd a-b-c: 1.3289. As indicated above, the wave [C] has ended at 1.7509. The selloff from there is now unfolding which itself should be labeled as an impulsive wave with wave 1: 1.5186 (diagonal wave 1), followed by wave 2: 1.6096 and wave 3: 1.2451, wave 4: 1.4380, wave 5 as well as larger degree circle wave C has possibly ended at 1.2129 and major correction has possibly commenced for retracement of recent decline towards 1.4000, then 1.4180-90 (38.2% Fibonacci retracement of 1.7509-1.2129). Below said support at 1.2129 would risk weakness to psychological support at 1.2000 and then 1.1851 (50% projection of 1.7509-1.2451 measuring from 1.4380) but reckon 1.1500 would remain intact, bring reversal later.


