
For one to say that support and resistance (S/R) is important would be a huge understatement. It’s absolutely crucial!
We would even go as far to say that without sound knowledge of S/R, your odds of success (particularly for technical traders) are significantly diminished.
The good news is that S/R comes in all shapes and sizes, with some even calculated for you. Much like psychological numbers, Pivot Point levels are, for the most part, objective.
Initially employed by pit traders on the floors of equity and futures exchanges, Pivot Point levels have, for most technicians, proven useful in the currency markets.
How Pivot Points are displayed
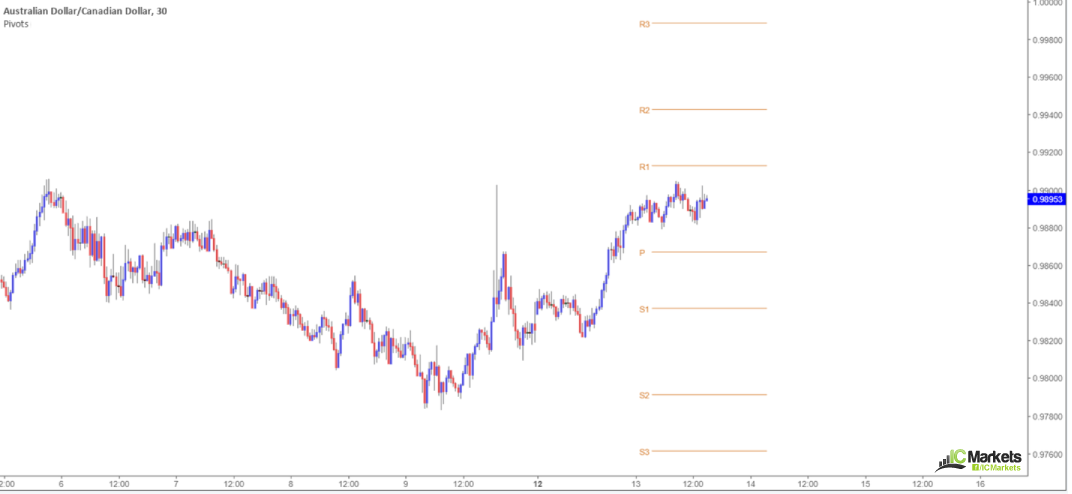
As you can see from the chart above, the arrangement consists of seven levels:
- The ‘P’ represents the Pivot Point.
- R1, 2 and 3 are corresponding resistances.
- S1, 2 and 3 are corresponding supports.
Assembled in daily (as above), weekly, monthly and yearly format, Just about any type of trader can find use in this tool.
Different types of Pivot Points
Although generally most technicians tend to favour the standard/classic method of calculating Pivot Points (like the one depicted on the chart above) there are other calculation techniques sometimes employed, such as:
- Camarilla Pivot Points.
- Fibonacci Pivot points.
- Woodie Pivot Points.
- DeMark Pivot Points.
In order to calculate Standard, Camarilla and Fibonacci Pivot Points you must have the previous period’s high, low and close prices. For Woodie Pivot Points you need to have the previous period’s high and low prices, as well as the open price for the current period. And finally for DeMark Pivot points you’ll require the previous period’s open, high, low and close prices.
Another essential point to consider is that closing times will affect calculations. As the currency market effectively has no open and closing times throughout the week, one must select a session close. Typically, traders tend to hone in on the London midnight closing price or the 17.00pm New York close.
There are additional calculations required in order to generate the corresponding support and resistances. Luckily though, most platforms will calculate the whole process for you so you can focus on what’s important: trading the markets.
Using Pivot Points
Like most technical tools, relying exclusively on one metric to base a trading decision on is not likely the best path to take. However, when price converges at a point in which multiple technical tools come together, this is where the high-probability trading setups are found i.e. points of confluence.
Points of confluence are, from a technical standpoint, the Holy Grail. There’s not really much that compares!
Below is an example of such confluence at work:
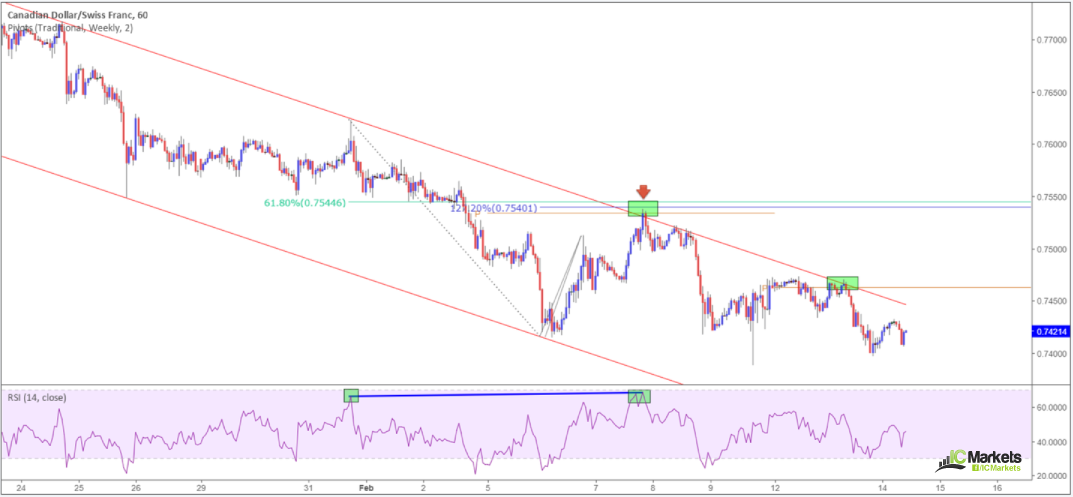
This is quite a detailed setup, and therefore will likely be a good example for beginners to learn from. Notice we have the following tools merging around the 0.7540ish area for a short (upper green box):
- H1 descending channel resistance.
- A H1 61.8% Fib resistance at 0.7544.
- A H1 127.2% Fib ext. point at 0.7540.
- A weekly Pivot Point (granted, for some traders the pivot (P) isn’t considered S/R, but rather a mid-point with which the corresponding S/R levels can be calculated).
- RSI nearing its overbought value and also showing divergence.
That’s five reasons here using the above example, to short the Canadian dollar, which, as you can see, takes into account that there’s a weekly Pivot Point present.
Pivot points are most certainly a worthy addition to one’s trading arsenal
Nevertheless, while Pivot Points are a notable tool, it should NEVER take precedence over market structure. What we mean by market structure is price action: supply and demand, support and resistance, trendlines, channels etc. Once you have a good feel for structure, you can then set about confirming the areas with additional tools, such as Pivot Points, Fibonacci studies, RSI movement etc.
A few take-away points:
- Pivot Points are horizontal support and resistance lines that are usually calculated directly on the platform’s chart.
- Pivot Points can be traded in the same way as traditional S/R levels.
- Pivot points, when combined with other tools, are high-probability points of reversal. Used alone, the odds of a reaction being seen are diminished.
- Each corresponding S/R is calculated from the main Pivot Point. Remember, though, this is done for you on the majority of platforms.
- Levels above the main Pivot Points are resistances, whereas levels below are supports.
If calculating manually, remain cognizant of market closing times.