
The markets originally looked set for a general trend reversal with the synchronized sharp decline in US stocks, yield and the Dollar leading into 2017. Nonetheless, equities staged a strong come back towards the end of last week and helped stabilized both yields and the greenback. The overall solid non-farm payroll report, with strong wage growth, provided some support to sentiments. But it looked more like the trump rally is back in force. While there are still risks of trend reversals, it’s much lowered now with S&P 500 and NASDAQ closing at record high at 2276.98 and 5521.06 on Friday. DJIA also just missed 20000 handle by a hair and reached as high as 19999.63 before closing at 19963.80. The coming would be crucial to the overall developments in the markets as Donald Trump’s inauguration day on January 20 approaches.
In the currency markets, Dollar ended as the second weakest major currency over the week, just next to Sterling. Nonetheless, the greenback holds on to key near term support level against other major currencies. EUR/USD is kept below 1.0652, GBP/USD below 1.2509. USD/CHF held above 1.0019 and USD/JPY above 114.76. Canadian dollar was the strongest one with the help of resilience in oil price and stellar December job data. Nonetheless, USD/CAD is also held above 1.3080 key near term support. These levels will be closely watched this week to see if the greenback can defend its bullish trend.
Comments from Fed officials could also be part of the determining factors. Chicago Fed president Charles Evans, a known dove, said on Friday that two Fed rate hikes this year is "not an unreasonable expectation. And, with stronger than expected economic data coming in "three is not going to be implausible:". Cleveland Fed president Loretta Mester said that she’s been "seeing a little more strength in the economy" and three hikes in 2017 is "probably" appropriate. Richmond Fed president Jerry Lacker said that Fed "may need to increase more briskly than markets appear to expect, depending on developments as the year unfolds." Current, Fed fund futures are pricing in 67.2% chance of another hike by June.
Looking at the technical, S&P 500’s pull back proved to be brief and up trend resumed quickly. Outlook will now stay bullish as long as 2233.62 support holds. Current up trend is in progress for 61.8% projection of 1074.77 to 2134.71 from 1810.10 at 2465.14 in medium term term. We’d expect that strength in the stock markets will give room for Fed to hike rates as they protected in December’s forecasts. That is, three hikes this year.
10 year yield suffered sharp decline to 2.339 last week before closing at 2.418. The development indicates short term topping at 2.621 and TNX has turned into a corrective phase. Friday’s rebound was not strong enough to warrant completion of the correction yet. And we could see another dip to 55 day EMA (now at 2.263) and below. And that would limit Dollar’s strength for resuming recent up trend. Though, strong support is expected at 38.2% retracement of 1.336 to 2.621 at 2.130 to contain downside.
Dollar index’s sharp fall also indicates short term topping at 103.82, ahead of 61.8% projection of 78.90 to 100.39 from 91.91 at 105.19. Bearish divergence condition in daily MACD also raised the chance of a relatively lengthier consolidation. At this point, we’d expect strong support from 99.43 to contain downside and bring rise resumption. Above 103.82 will target 105.19 next. However, break of 99.43 will indicate that recent rise from 91.91 has completed and deeper pull back would be seen.

Regarding trading strategies, firstly, we’re holding on to our AUD/USD short (sold at 0.7550). The rebound from 0.7158 was stronger than we expected. Also, support from 0.7144 seemed strong. The development raised some doubts on our bearish outlook. In our preferred case, fall from 0.7777 is seen as resuming the larger down trend and should be an impulsive move. In the alternate case, price actions form 0.7833 are forming a three wave consolidation pattern with fall from 0.7777 as the third wave. And in that case, fall from 0.7777 should also be an impulsive move. Therefore, we’re still expecting another dip at least for a test on 0.7144/7158 support zone. So, we’ll hold on to the short position and keep the stop at 0.7450, and pay attention to the structure of the next near term fall to decide to keep or quit. Meanwhile, we’d like to reiterate that strong break of 0.7144 will indicate larger down trend resumption for a new low below 0.7826.
Secondly, we’re holding on to our EUR/USD short position (sold at 1.0504). We’d looking at down trend resumption which would extend to parity and even next medium term target at 0.9115. However, downside momentum has been very unconvincing so far. Nonetheless, we’ll hold on to the position for the moment and keep our stop at 1.0670, which wasn’t hit by the rebound from 1.0652.
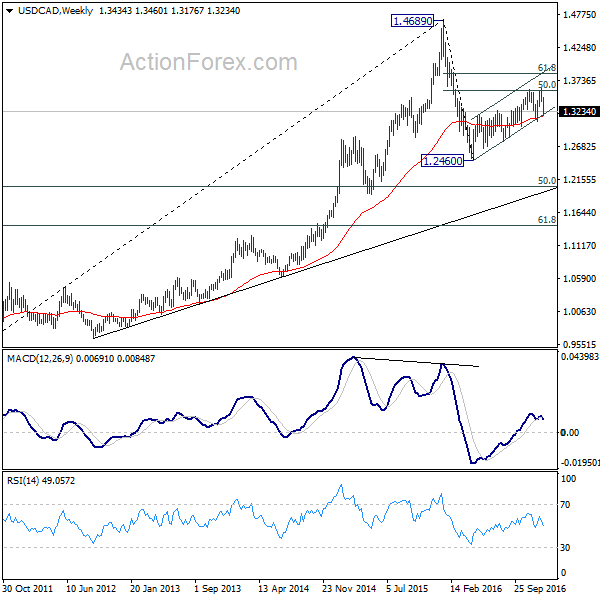
USD/CAD Weekly Outlook
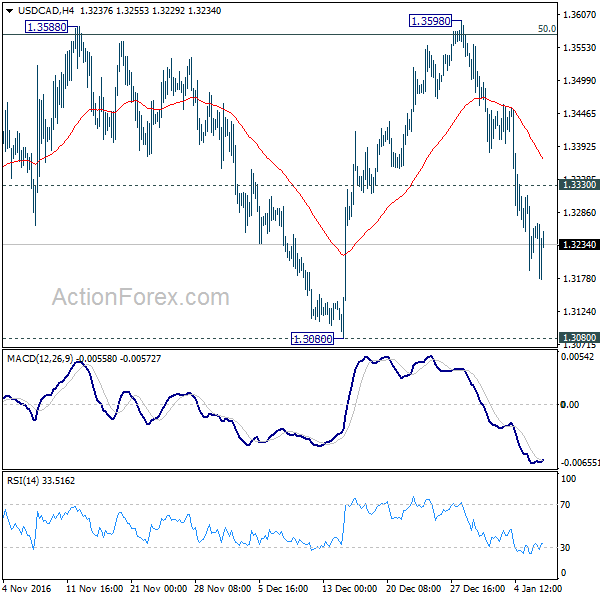
USD/CAD’s fall from 1.3598 extended to as low as 1.3176 last week. Initial bias stays on the downside this week for 1.3080 support next. As noted before, price actions from 1.2460 are viewed as a corrective move. Decisive break of 1.3080 will indicate that it’s completed and turn outlook bearish for retesting 1.2460 low. On the upside, above 1.3330 minor resistance will turn bias neutral again with focus back on 1.3588/98 resistance zone.
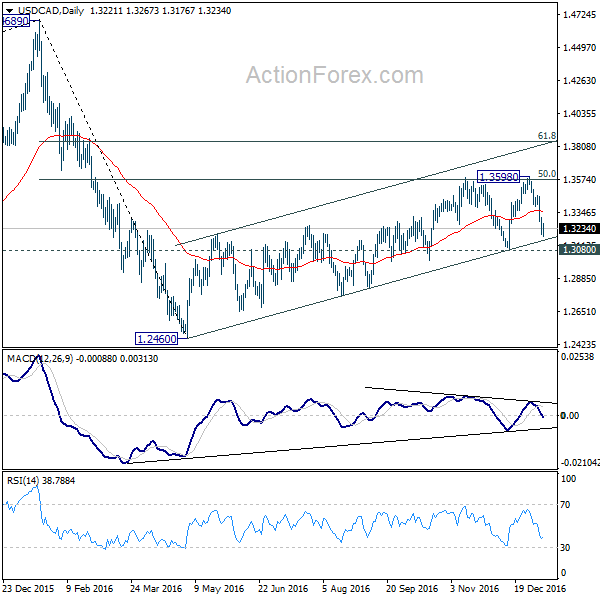
In the bigger picture, price actions from 1.4689 medium term top are seen as a correction pattern. The first leg has completed at 1.2460. The second leg is possibly finished at 1.3598 too after hitting 50% retracement of 1.4689 to 1.2460 at 1.3575. Break of 1.3080 would likely resume the fall from 1.4689 through 1.2460 to 50% retracement of 0.9406 to 1.4689 at 1.2048. We’d start to look for reversal signal below 1.2460 to complete the correction. In case of another rise, we’ll look for topping sign at 61.8% retracement of 1.4689 to 1.2460 at 1.3838.
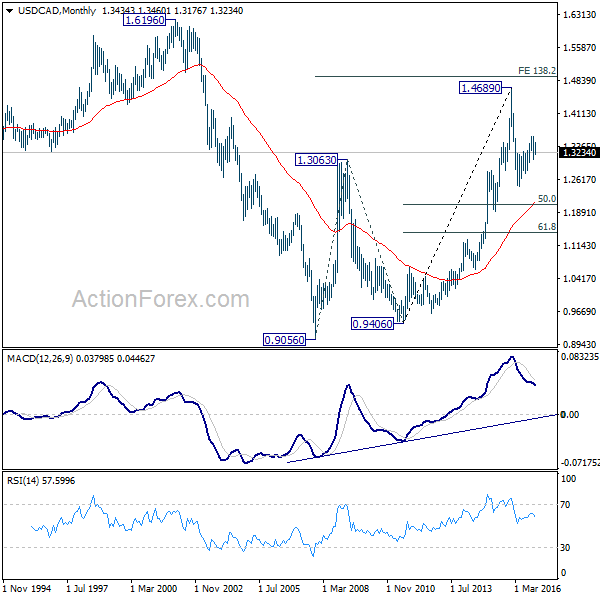
In the longer term picture, rise from 0.9056 (2007 low) is viewed as a long term up trend. It’s taking a breath after hitting 1.4689. But such rise expected to resume later to test 1.6196 down the road.
Subscribe to our daily and mid-day newsletter to get this report delivered to your mail box