Yen surged broadly last week and ended as the strongest one as partly driven by flattening yield curve, and partly by global risk aversion. Selloff in oil was one of the major factors driving equities down. Euro and Swiss Franc followed Yen with the common currency supported solidly by strong German GDP. On the other hand, commodity currencies ended as the weakest ones. In particular, data from Australia suggested that RBA would stay on hold for longer than originally expected. Meanwhile, inflation data from Canada argued that BoC won’t rush into another rate hike. News from US were mixed. On the positive side, a big step was made with passage of the tax bill in House. On the negative side, the real challenges lie in Senate where Republicans only have a slim majority. And, efforts to reconcile the bills of both chambers are huge. Also, there are concerns of political instability as Special Counsel Robert Mueller’s Russian probe is getting closer to US President Donald Trump. But so far, US financial markets have displayed much more resilience than others.
More on yield curve and tax plan
- House Passes Its Tax Bill. The Next Challenges Are…
- Flattening Of US Yield Curve Likely Continues As Fed’s Tightening Has Just Started
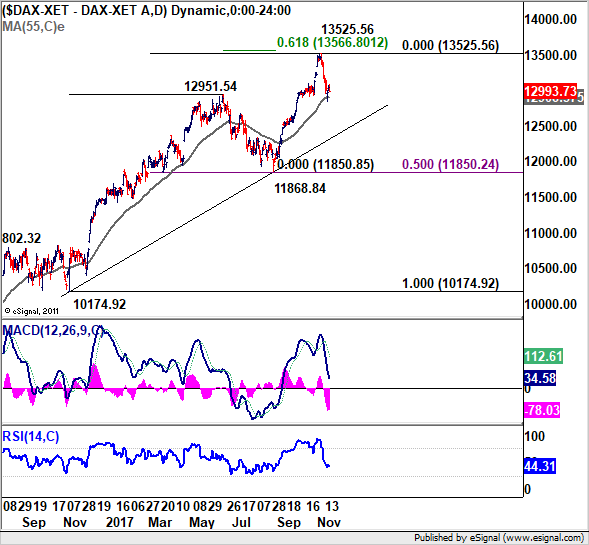
DAX to take on trend line support
DAX’s sharp fall in the past two weeks indicates that rise from 11868.84 has completed at 13525.56, just ahead of 61.8% projection of 10174.92 to 12951.54 from 11868.64 at 13566.80. Deeper correction is now in favor through 55 day EMA (now at 12908.37), to medium term trend line support (now at 12351. Nonetheless, there is no clear sign of long term trend reversal yet. Thus, strong support should be seen well above 11868.84 cluster (50% retracement of 10174.92 to 13525.56 at 11850.24) to bring rebound.
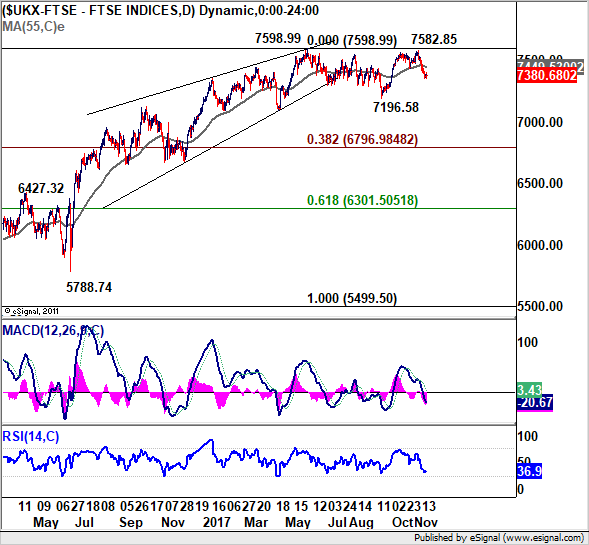
7196.58 double top neck line crucial to FTSE
FTSE’s decline from 7582.85 also extended last week and confirmed the rejection from 7598.99 record high. Deeper fall remain in favor in near term. But we’d look for strong support from 7196.68 to bring rebound. However, firm break of 7196.58 will complete a double top pattern (7598.99, 7582.85) which indicates trend reversal. And in that case, FTSE should dive further lower to 38.2% retracement of 5499.5 to 7598.99 at 6796.98 at least.
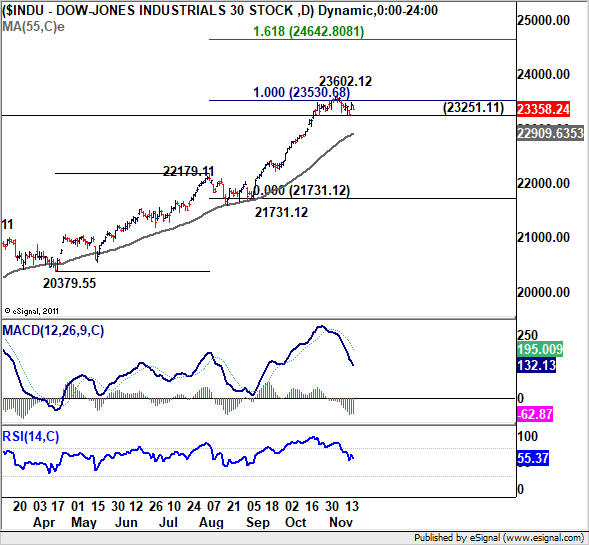
DOW maintained bullishness by rebound from 23251
On the other hand, US stocks were much more resilient and NASDAQ even made record high at 6806.67 last week. DOW formed a short term top earlier after hitting 100% projection of 20379.55 to 22179.11 from 21731.12. But the subsequent pull back was much shallower than other indices like those to mentioned above. Indeed, DOW drew support from 23251.11 after breaching briefly. The development maintained bullishness in the index. Break of 23602.12 will pave the way to 161.8% projection at 24642.80. However, firm break of 23251.11 will drag the index back to 55 day EMA (now at 22909.64) before resuming the up trend.
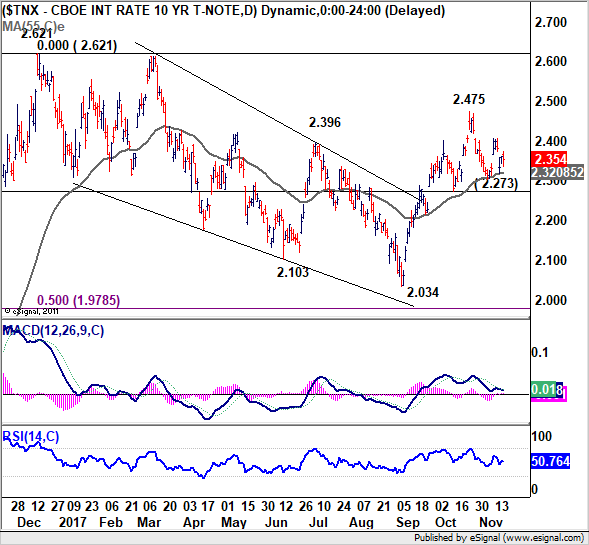
TNX stays well above 2.273 support
10 year yield also dipped sharply during the week but it managed to draw support from 55 day EMA now at 2.302. Also with 2.273 support intact, outlook remains bullish. Rise from 2.034 low is still expected to resume later through 2.475 to retest 2.621 key resistance. However, firm break of 2.273 will argue that rebound from 2.034 has completed. And, the corrective pattern from 2.621 is extending with another fall back towards 2.034 low.
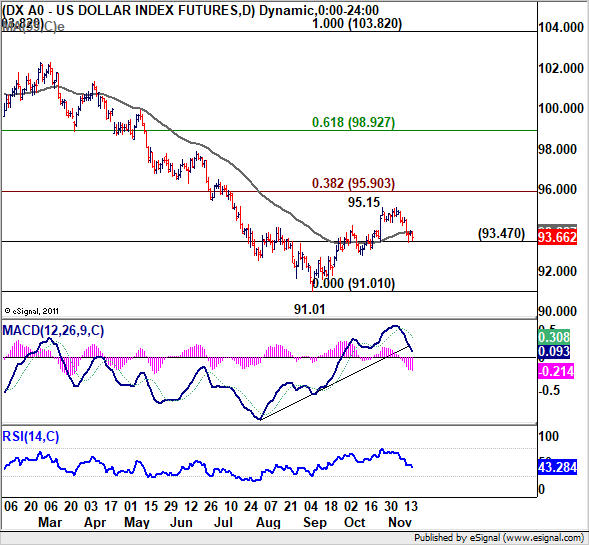
Dollar index pressing 93.47 support
Dollar index also suffered steep selling as Dollar was heavily pressured against both Euro and Yen. But for the moment, it’s still holding on to 93.47 key near term support. And near term outlook remains bullish for another rise through 95.15 to 38.2% retracement of 103.82 to 91.01 at 95.90 and above. However, firm break of 93.47 will turn near term outlook bullish and should at least target a retest on 91.01 low.
US markets displayed resilience, fate depends on tax bill
Judging from the above charts, while Dollar was down, it isn’t out yet even though the bullish outlook now looks a bit shaky. Looking at the pairs, EUR/USD led the way in bullish reversal as fall from 1.2091 should have completed at 1.1553. More upside would be likely in EUR/USD for retesting 1.2091. USD/JPY will be testing 111.64 key support this week. A strong rebound from there would retain bullishness. However, break will open up deeper fall back to 110 and possibly below. USDCHF’s fall from 1.0037 looks corrective so far and is held above 0.9835 support. USD/CHF stays bullish. GBP/USD stayed in range of 1.3026/3337 and the decline from 1.3651 is still in favor to resume after the consolidation completes.
The developments with the tax bill in Senate will be a key to US markets as well as the greenback. The vote could be delayed to the week after thanksgiving. Passage of the tax bill will give the greenback a relief rally and then comes the negotiations between House and Senate. Meanwhile the Russian probe might occasionally give Dollar some jitters. But in the end, the impacts should be temporary. It seems that after nearly a year working with Trump, the Republicans have found a way. That is, carry on business as usual, ignore him, disregarding his tweets and the provocations to other Republicans. With or without Trump, the Republicans will work on the tax bill.
Trading strategies
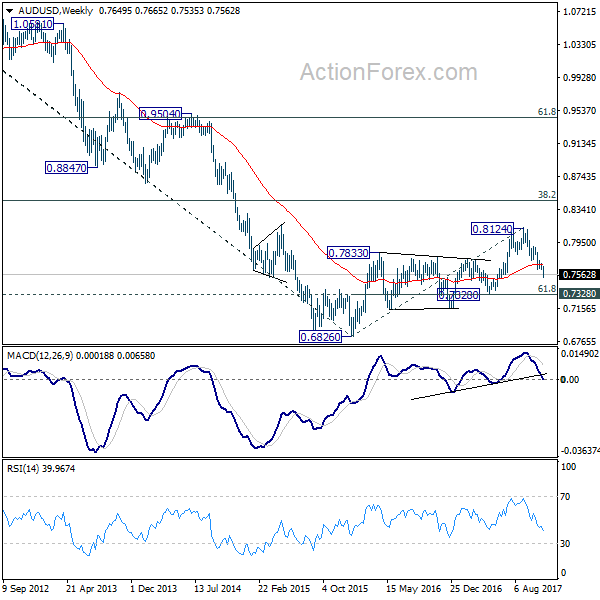
Our USD/JPY long (bought at 114.50) was stopped out at 112.80 with 170 pips loss as selloff accelerated. On the other hand, we entered AUD/USD short at 0.7624. Our view is unchanged that AUD/USD’s medium term rise from 0.6826 has completed at 0.8124 and the long term down trend is possibly resuming. The first target will be 0.7328 cluster support (61.8% retracement of 0.6826 to 0.8124). But we’ll also look at downside momentum to assess the chance of breaking through 0.6826 low. We’ll hold on to AUD/USD short, with stop lowered to 0.7624 (break even), slightly above 0.7607 minor resistance.
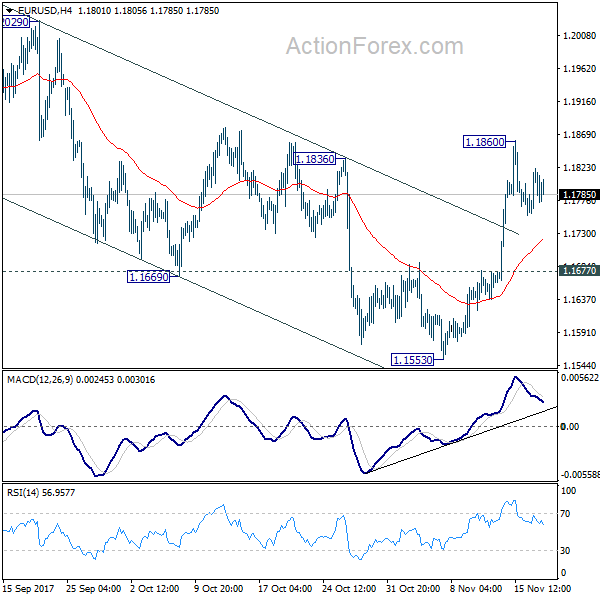
EUR/USD Weekly Outlook
EUR/USD’s strong rally last week suggests that corrective fall from 1.2091 has completed at 1.1553 already, ahead of 38.2% retracement of 1.0569 to 1.2091 at 1.1510. With a temporary top formed at 1.1860, initial bias is neutral this week first. Downside of retreat should be contained above 1.1677 minor support to bring another rally. Break of 1.1860 will turn bias to the upside for retesting 1.2091 high. However, break of 1.1677 will turn focus back to 1.1553 low instead.
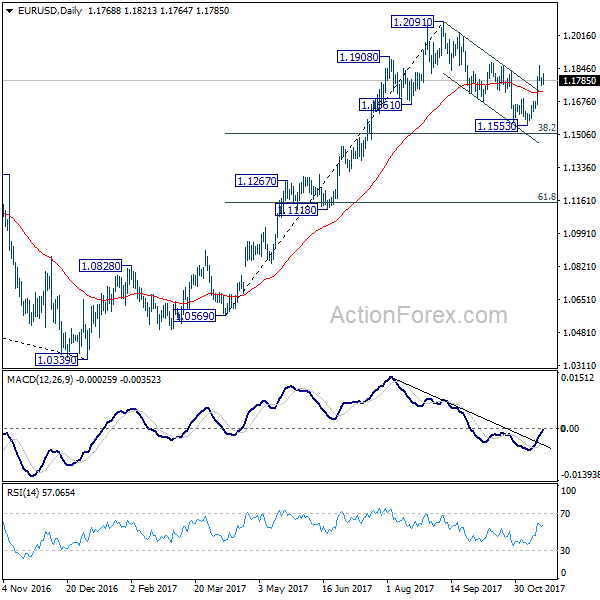
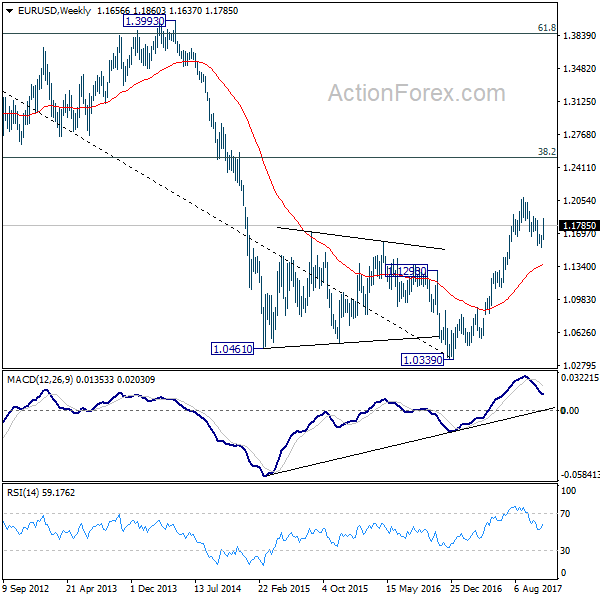
In the bigger picture, rise from 1.0339 medium term bottom is seen as a corrective move for the moment. Therefore, in case of another rally, we’d be cautious on 38.2% retracement of 1.6039 (2008 high) to 1.0339 (2017 low) at 1.2516 to limit upside and bring reversal. Meanwhile, sustained trading below 55 week EMA (now at 1.1373) will suggest that such medium term rebound is completed and could then bring retest of 1.0339 low.
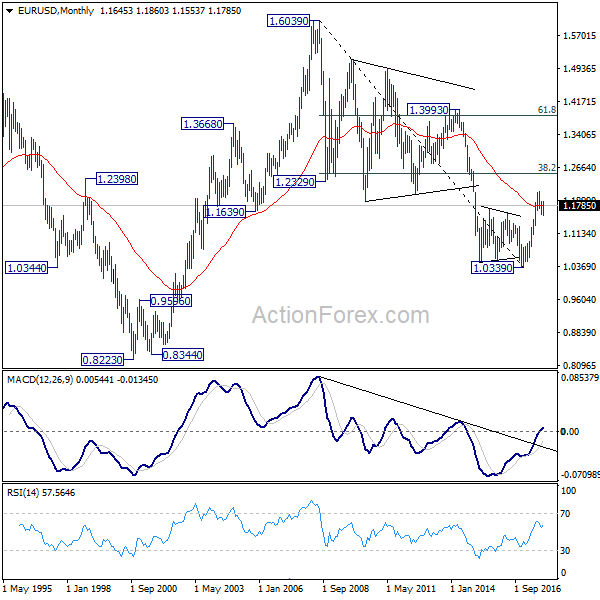
In the long term picture, 1.0339 is now seen as an important bottom as the down trend from 1.6039 (2008 high) could have completed. It’s still early to decide whether price action form 1.0339 is developing into a corrective or impulsive move. On the upside, strong resistance could be seen from 38.2% retracement of 1.6039 to 1.0339 at 1.2516. On the downside, we’re not anticipating a break of 1.0339 in near to medium term.