EUR/USD
The American dollar edged higher only against the common currency this Wednesday, as speculative interest chose to lock gains ahead of the ECB’s monetary policy meeting taking place this Thursday. Volumes were low, with most of the decline taking place during the first half of the day, despite a scarce macroeconomic calendar. The greenback maintained the soft tone, down against the rest of its major rivals, in spite of better-than-expected US housing data, which showed that housing starts rose at its fastest pace in four months, up in June by 8.3% or 1.215 million. Building permits also beat expectations, up by 7.4% or 1..254 million.
The European Central Bank is largely expected to maintain its monetary policy unchanged, but to maintain the optimistic stance offered in the previous meeting. Tapering is expected to be discussed in the next meeting, which will take place in September, but any hint on the subject will be taken as a trigger to buy the common currency.
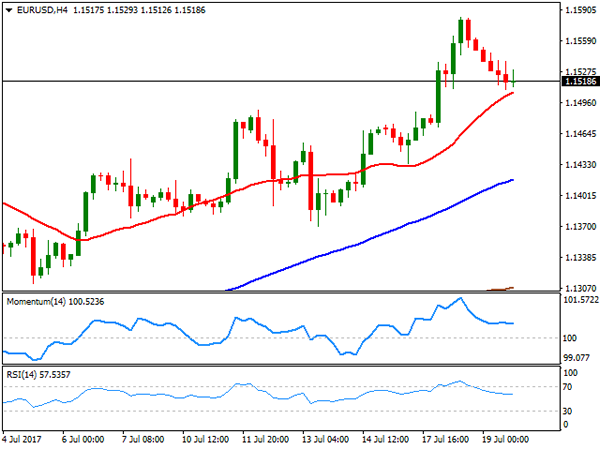
The daily decline seems barely corrective as in the 4 hours chart the bullish structure remains intact, as the price remained above a bullish 20 SMA, while the 100 and 200 SMAs have extended their advances below the shortest. Technical indicators in the mentioned chart have corrected extreme overbought readings before losing downward strength within positive territory. The bearish potential will increase on a downward acceleration below 1.1490, while the key resistance comes at 1.1615, May 2016 high, with gains beyond the level favoring another 100 pips’ gain.
Support levels: 1.1490 1.1460 1.1420
Resistance levels 1.1550 1.1580 1.1615
USD/JPY
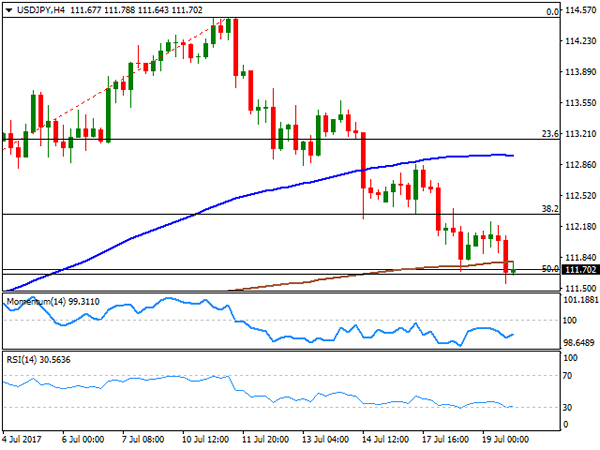
The USD/JPY pair extended its decline down to 111.55 this Wednesday, its lowest since June 27th, with persistent dollar’s weakness being the main driver for the pair. US data released ahead of Wall Street’s opening came in better-than-expected, but was not enough to push the pair back above the 112.00 level, and in fact the mentioned low was achieved after the release. During the upcoming Asian session, Japan will release its trade balance figures for June, and more relevant, the latest monetary policy decision from the local Central Bank. Investors are not expecting any surprise from Kuroda and Co. this time, although there were some rumors making the rounds that the BOJ will drop its inflation target during this meeting. Policymakers will focus on the yield-curve control, which is seen as negative for the yen. Anyway, and with the ongoing dollar’s weakness, a sharp recovery seems quite unlikely. Technically, the risk remains towards the downside, given that in the 4 hour chart, the price is right below its 200 SMA and barely holding above the 50% retracement of its June/July advance at 111.60, the immediate support, whilst technical indicators lost directional strength, but remain well below their mid-lines.
Support levels: 111.60 111.20 110.90
Resistance levels: 112.30 112.70 113.10
GBP/USD
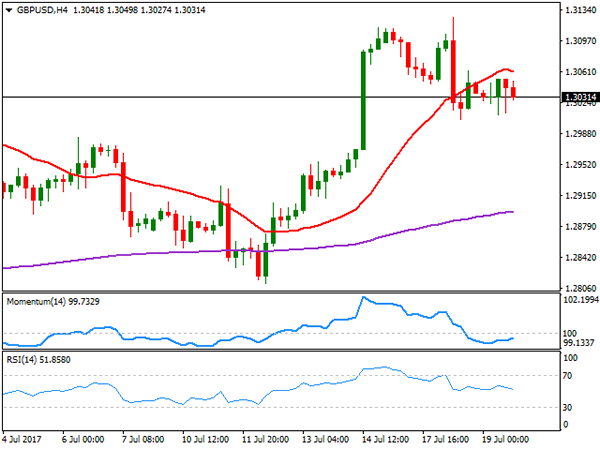
The GBP/USD pair closed the day unchanged around 1.3030, having consolidated above the 1.3000 mark but unable to recover beyond 1.3050 daily basis. There were no macroeconomic news coming from the UK and US ones were ignored, but things could become more interesting this Thursday, as the kingdom will release June retail sales, expected much better than those of May, while Brexit minister David Davis will head to Brussels for another round of Brexit talks. For the pair is the battle of the "less weak," as speculative interest is dumping the greenback on local political jitters and fears the Fed will have to slow its tightening pace, while for the Pound, reduced chances of a BOE’s hike and Brexit uncertainty weigh. From a technical point of view, the intraday picture is neutral-to-bearish, as the pair developed below its 20 SMA, whilst the Momentum indicator remains horizontal, right below its mid-line, whilst the RSI indicator heads marginally lower within neutral territory.
Support levels: 1.3000 1.2965 1.2920
Resistance levels: 1.3050 1.3090 1.3130
GOLD
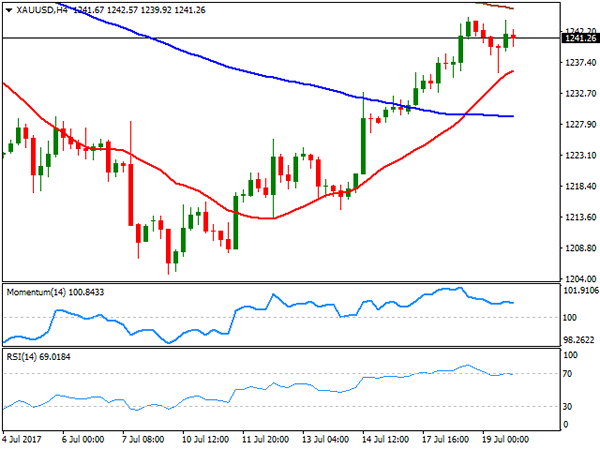
Gold eased modestly this Wednesday, settling at $1,241.30 a troy ounce, easing modestly as dollar’s bleeding stalled. The commodity eased at the beginning of the day, tracking the common currency’s behavior, but bounced from a daily low of 1,235.88 with the downside limited amid fading prospects of continued tightening in the US monetary policy. Additionally, the positive tone in equities, despite modest, limited chances of a stepper recovery. Technically, the daily chart shows that the price settled now far from its weekly high and above its 20 and 200 DMAs, while the Momentum indicator extended its advance beyond the 100 level, as the RSI turned flat around 55, all of which maintains the risk towards the upside. In the 4 hours chart, a bullish 20 SMA keeps leading the way higher, now providing a dynamic support at 1,236.30, while technical indicators have partially corrected extreme overbought readings before turning flat well above their mid-lines.
Support levels: 1,236.30 1,228.30 1,216.60
Resistance levels: 1,245.20 1,252.50 1,261.90
WTI CRUDE OIL
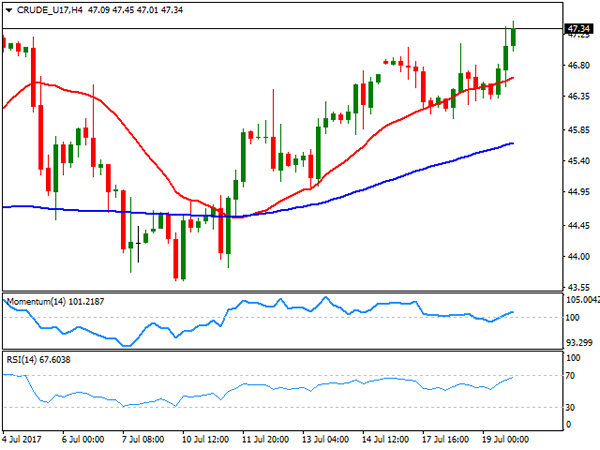
Crude oil prices extended their recovery this Wednesday, with West Texas Intermediate futures reaching a 6-week high of 47.45 to settle at $47.40 a barrel, underpinned by an unexpected fall in US oil inventories. According to the EIA, crude stockpiles fell by 4.73 million barrels in the week ended July 14th, well above market’s expectations. Gasoline stocks also declined, by 4.4 million barrels. The positive news offset Ecuador announcement of its plans to abandon OPEC’s output cut deal to shore up its finances from late Tuesday. Daily basis, the commodity has room to extend its advance, as the price remains well above a bullish 20 DMA, whilst the RSI indicator turned south, now around 60. The Momentum indicator in the mentioned chart remains flat around its 100 level, as the price surpassed previous relevant high by a couple of cents. The 100 DMA in the mentioned chart stands at 48.00, providing an immediate resistance. In the 4 hours chart, WTI is biased higher, having held above a bullish 20 SMA whilst technical indicators maintain their bullish slopes within positive territory.
Support levels: 47.00 46.40 45.90
Resistance levels: 47.45 48.00 48.60
DJIA
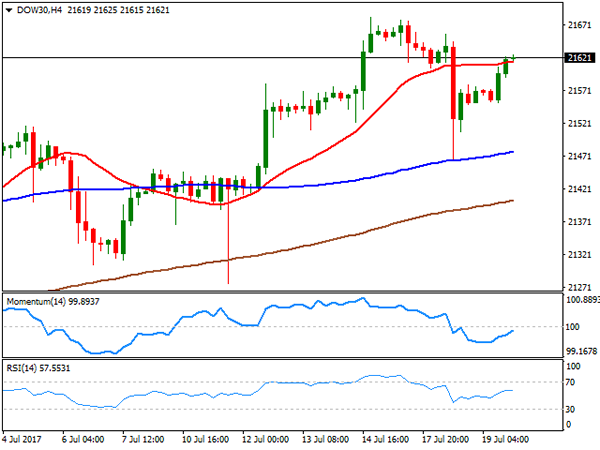
US indexes closed with gains this Wednesday, as markets stabilized ahead of key events taking place this Thursday, including two central banks announcements. The Dow Jones Industrial Average added 64 points, to close the day at 21,639.38, while the S&P closed at a new record high of 2,473.82, up by 13 points or 0.54%. The Nasdaq Composite gained 40 points and ended at 6,385.04, also a fresh all time high and up by a ninth consecutive day, as the tech sector led the way higher, while a recovery in oil prices backed energy-related shares, and earnings reports came in better-than-expected. Within the Dow, only four members closed lower, with IBM being the worst performer, down 4.42%. El du Pont, on the other hand, led advancers by adding 1.58%, followed by Cisco Systems that gained 1.21%. The technical outlook for the DJIA is positive, given that in the daily chart, the index continues developing well above all of its moving averages, with the 20 DMA currently around 20,480, and the RSI indicator regaining the upside, now around 61. In the same chart, the Momentum indicator pared its decline and turned flat within positive territory, not enough to confirm additional gains ahead. In the shorter term, and according to the 4 hours chart, the index is settling barely above its 20 SMA, while the RSI indicator heads north around 58 and the Momentum aims north around its mid-line, in line with the longer term perspective.
Support levels: 21,605 21,556 21,508
Resistance levels: 21,651 21,682 21,730
FTSE100
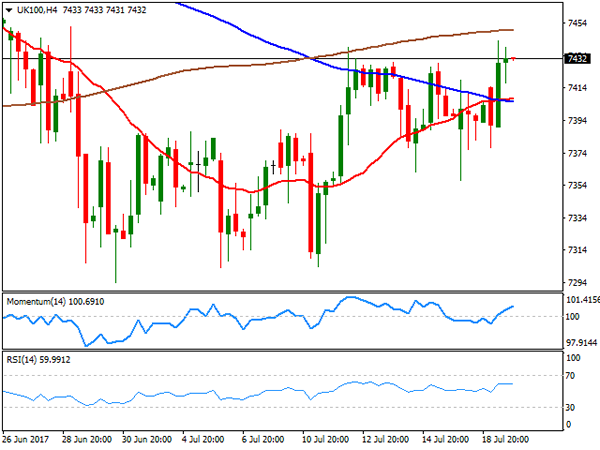
The FTSE 100 ended the day at 7,430.91, up by 41 points or 0.55%, helped by a surge in the home building sector and on news that Reckitt Benckiser got $4.2 billion for selling its food division. The best performer was Sage Group that added 2.68%, followed by Barratt Developments that gained 2.44%. Royal Mail led decliners, closing down 2.75%, followed by Paddy Power Betfair that shed 2.06%. The benchmark holds around the mentioned high ahead of the Asian opening, and presents a positive tone according to the daily chart, as technical indicators advanced within positive territory, maintaining its bullish slopes as the index advanced above its 20 and 100 DMAs, both around 7,380. For the shorter term, the 4 hours chart also supports an upward continuation, as the index also advanced beyond its 20 and 100 SMAs, while the Momentum indicator heads north well above its mid-line as the RSI indicator consolidates around 60.
Support levels: 7,362 7,333 7,304
Resistance levels: 7,413 7,439 7,482
DAX
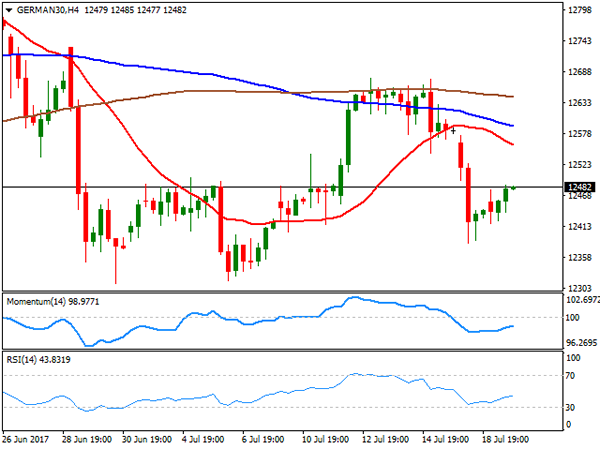
European equities managed to advance this Wednesday, with the German DAX up 21 points to 12,452.05, led by software company SAP which added 1.74%, as the sector was the best performer in the region. Infineon Technologies added 1.73%, also keeping the index afloat. On the downside, Commerzbank was the worst performer, shedding 2.95%. Trading was cautious ahead of the upcoming ECB monetary policy announcement this Thursday, with the index still trapped above a bullish 100 SMA and below a 20 SMA in the daily chart, whilst technical indicators continue hovering around their mid-lines. In the 4 hours chart, the risk remains towards the downside, as the index remains well below bearish moving averages, with the 20 SMA accelerating its decline below the larger ones, whilst technical indicators advanced modestly within bearish territory, not enough to support an upcoming rally.
Support levels: 12,459 12,404 12,354
Resistance levels: 12,510 12,567 12,610