
Ancient Maths For Modern Markets
Fibonacci analysis is a classic staple among chart technicians and is used by traders of all levels from all over the world; from successful independent traders right through to automated systems traders. This form of analysis often used by investment banks in their technical research notes and is among the simplest and most effective forms of analysis that traders can master.
Fibonacci analysis is essentially based on using the ratios which underpin the famous Fibonacci number sequence to identify key price levels in the markets. The most widely used forms of analysis are Fibonacci retracement and Fibonacci extensions.
Fibonacci Retracement
The Fibonacci retracement is an extremely well-used tool for helping traders identify levels of support and resistance. The tool comes as standard on the MT4 platform and helps traders measure a swing in price and identify key levels within that price swing which might serve as turning points if retested.
The key Fibonacci levels are:
23.6%, 38.2%, 50%, 61.8%, 78.6% and the 100%.
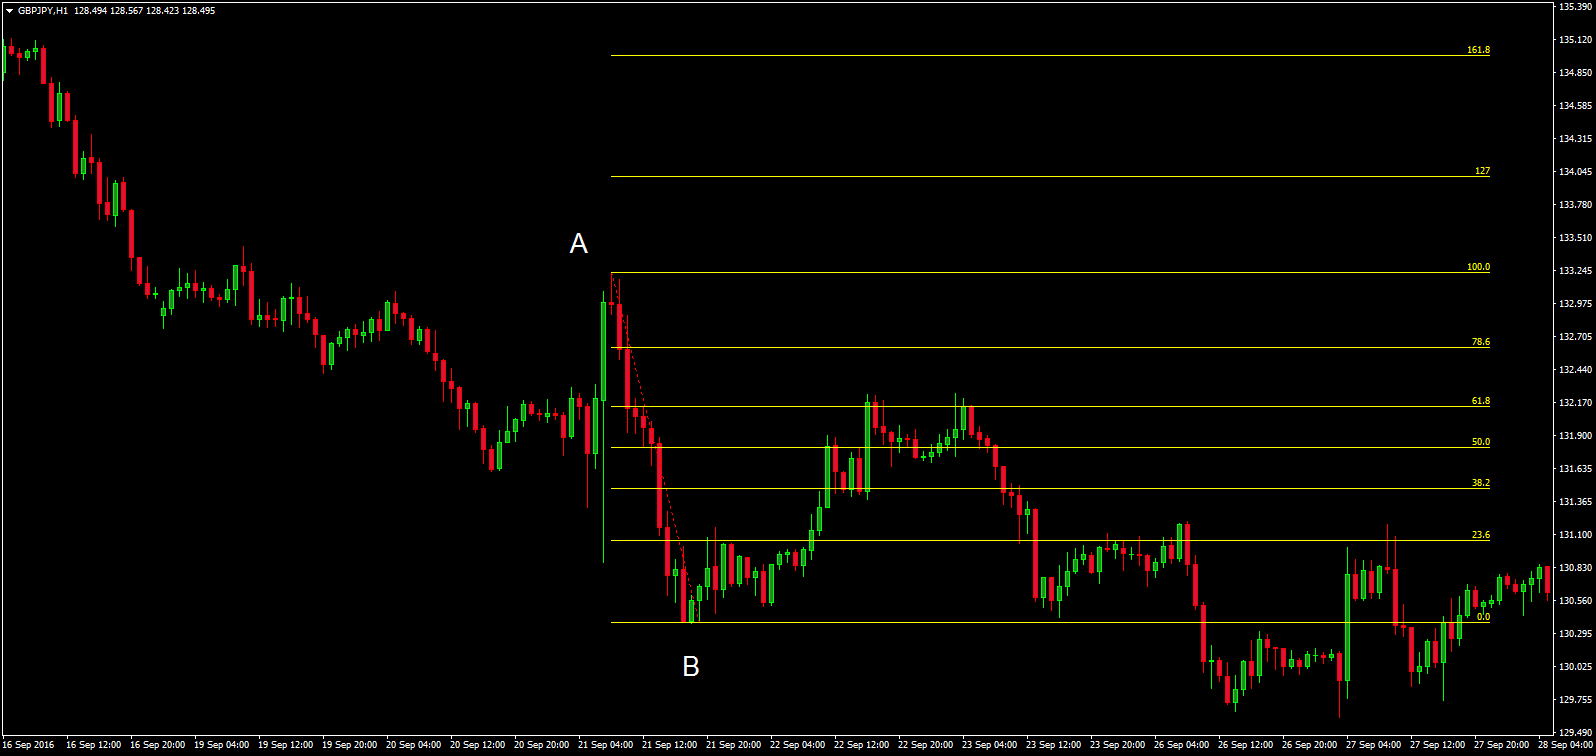
In the image above you can see that we have applied our Fibonacci retracement tool to a bearish price swing. Price sold off from point A to point B. Once price started to bounce from point B, we would apply our Fibonacci retracement tool measuring from the top of the swing to the bottom (and vice versa for a bullish move). The tool then plots on our key Fibonacci levels to monitor. As you can see price initially reversed from the 50% before travelling higher to test the 61.8% level which ultimately sends price lower.
This is a clear example of the basic way we can look to use Fibonacci retracement to identify trading opportunities. This can be particularly helpful in trending market helping us to enter as the market corrects, allowing us to get in as the trend then resumes.
Quick Tip:
The Fibonacci retracement tool highlights the key levels for us to monitor but we don’t know which, if any, will work. Traders should look to identify confluence between key Fibonacci levels and other technical elements such as price action signals, support & resistance, trend lines or indicator readings to build a proper trade idea.
Establishing Confluence
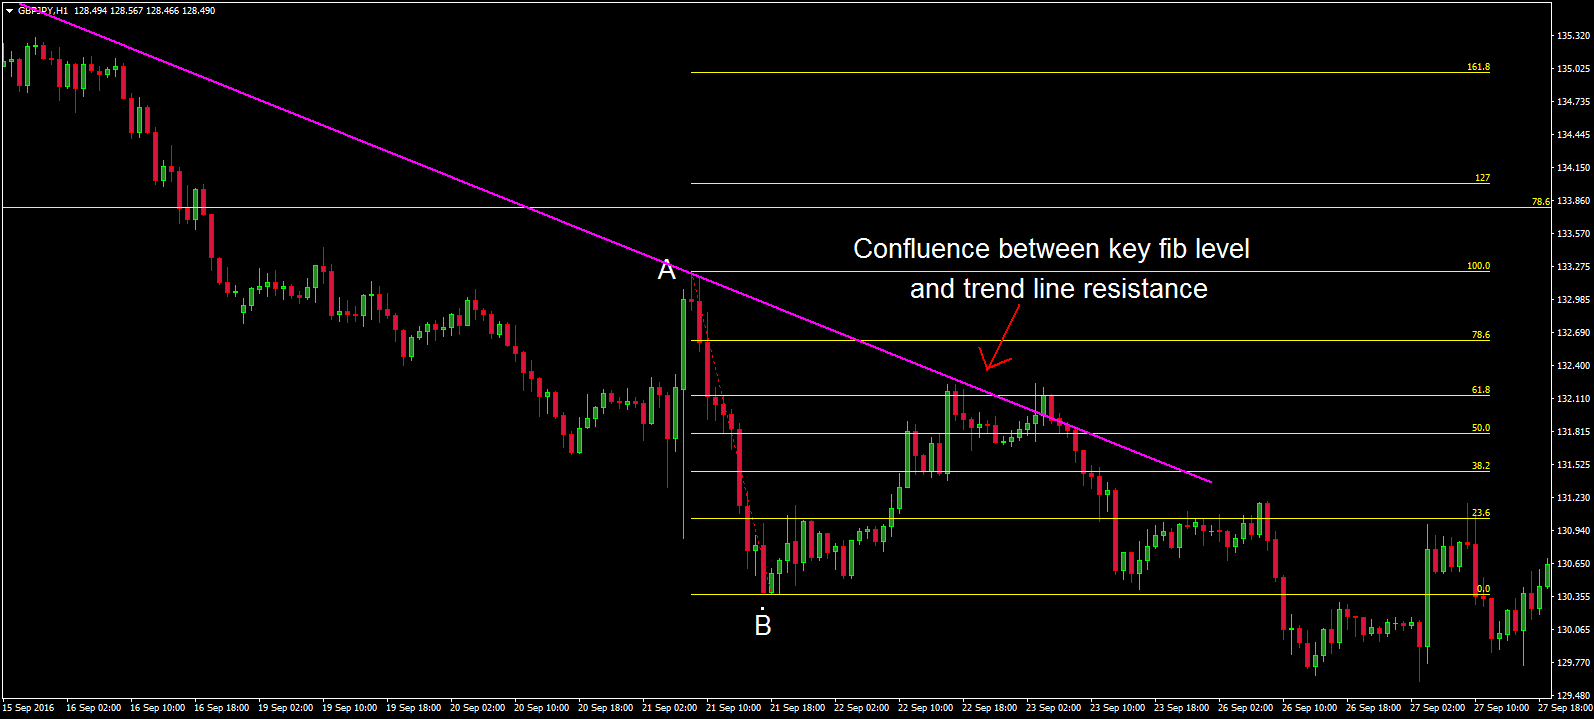
Looking at the example again you can see that we actually have confluence at the 61.8% Fibonacci level with trend line resistance coming in at that level also. This suggests that this would be the strongest level to look to trade.
The Fibonacci Extension
The Fibonacci extension is another classic analysis tool. This time, we measure the price swing but instead of looking for levels within the move which may serve as turning points if retested, we are looking at projected levels which are yet to be tested but could serve as turning points if they are.
The key Fibonacci extension levels are
127%, 161.8% 200%
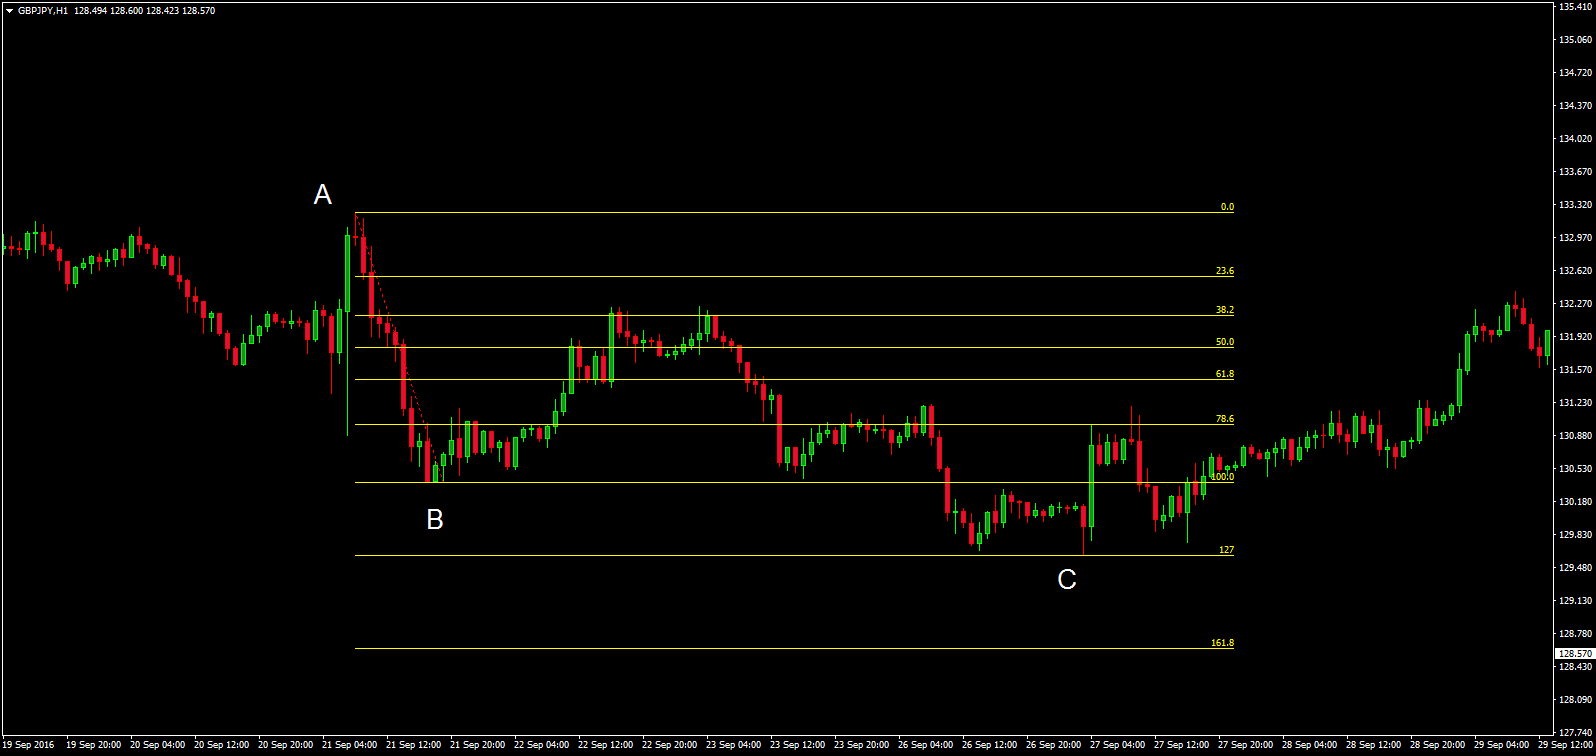
In the example, above you can see that we measure our bearish price swing from top to bottom (vice versa for bullish move) and this time the tool plots levels below the low of the swing point. At point C you can see what happens when price meets the 127% extension, it reverses and trades higher.
Again as with the retracement tool, we can look to identify confluence at key Fibonacci levels to help us identify the stronger levels to look to trade. Whereas we might look to use the Fibonacci retracement tool to help us identify points of correction in a trending market, the extension tool can be useful for identifying potential trend reversal zones and can also be used as a tool for setting profit targets whereby traders look to Bank any open trades as they test the key extension levels.
Summary
As you can see, Fibonacci levels can offer us powerful entry points to key moves. The tools are simple to use and once you are confident in tracking the right price swings you should be able to identify good reversals. The beauty of this method of technical analysis is that it really compliments other forms such as support & resistance, indicator trading, price action trading and is a versatile way to approach the markets.


