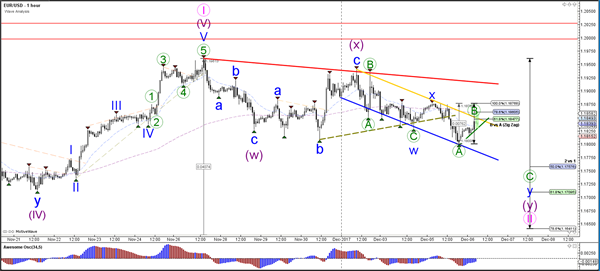
Currency pair EUR/USD
The EUR/USD is building a bearish correction as expected. The choppy and corrective price action is making a wave 1-2 (pink) pattern more likely. The bearish channel could take price down lower to the Fibonacci levels of wave 2. A break below the bottom (purple box) invalidates this wave pattern.
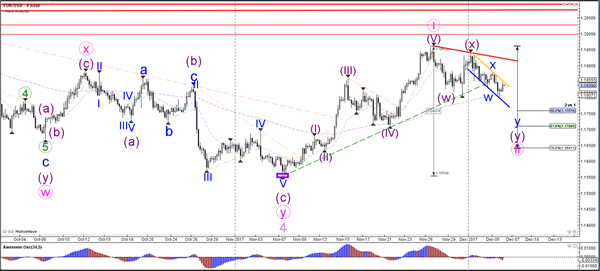
The EUR/USD broke below the support trend line (dotted green) and fell below 1.18 but is a sturdy pullback. This could be part of a wave B (green) within a larger bearish ABC zigzag.
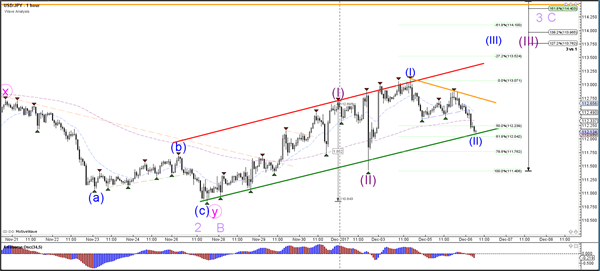
Currency pair USD/JPY
The USD/JPY is testing the bottom / support (green) of the uptrend channel. An impulsive bullish bounce could indicate that price is building a wave 2 (blue) whereas a sideways movement could mean a bear flag pattern and more downside.
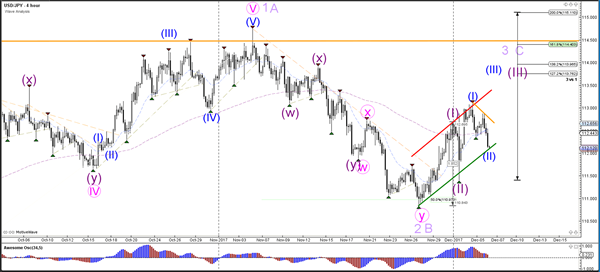
The USD/JPY will need to bounce at support first of all and later on break above the resistance (red/orange) to confirm the wave 3 pattern (purple). For the moment, price could have built a bearish ABC pattern within wave 2 (blue) and the Fibonacci levels and the support trend line could stop price from falling.
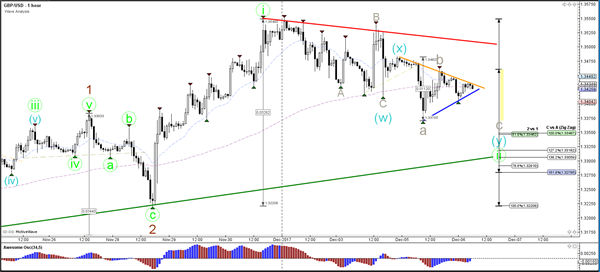
Currency pair GBP/USD
The GBP/USD is building a bearish correction which is probablypart of a larger a wave 1-2 (green).This is invalidated if price breaks below the 100% Fibonacci level of wave 2 vs 1.
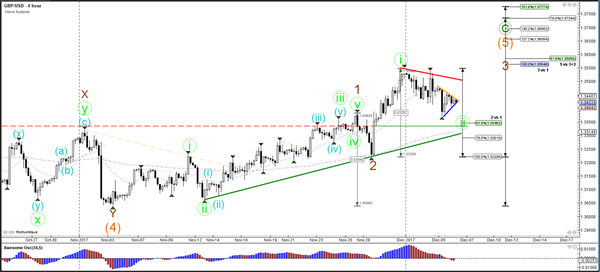
The GBP/USD is showing a triangle chart pattern (orange/blue). A break below or above the triangle could indicate a potential breakout.