
Technical analysis is an efficient technique used to study price movements of financial markets, with its findings forming a credible guide to future market direction.
One of the most well-known chart patterns is the head and shoulders formation, boasting not only high profitability, but also distinct rules for its assembly.
Although considered a high-probability pattern, its construction is somewhat complex and is likely the cause of inaccurate results for most traders. This article’s mission, therefore, is to simplify the head and shoulders pattern so trading it becomes not only lucrative, but enjoyable.
Breaking down the rules
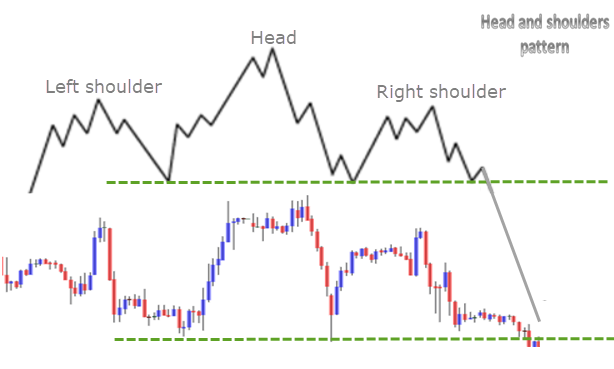
(Figure 1.1)
The head and shoulders pattern is most often visible as a top or bottom (inverse head and shoulders, or head and shoulders bottom): a reversal pattern, or trend reversal pattern.
Structure, concerning a top pattern (which will be the main focus of this piece), takes shape through a series of three well-defined peaks, either sharp or rounded. The second peak is higher than the first and third peak. The central peak is the head section of the pattern. The initial peak is the left shoulder and the third peak is the right shoulder (see figure 1.1 for a visual representation of a head and shoulders top).
Although both the left and right shoulders should always be positioned beneath the head, the two shoulders do not have to align at the same height.
To help make the formation easier to grasp, the research team at IC Markets produced a comprehensive step-by-step guide using real charts:
The first phase is locating the market’s trend. Depending on the trading style adopted, trend cycles will differ according to timeframe. This is the fractal nature of the market.
As an example, figure 1.2 illustrates WTI trending in a northerly direction on the H4 timeframe that broke a major high to the left at $72.88 (red arrow). Further adding to this, the trend prior to forming a higher high (or a new high) was bullish (green arrow).
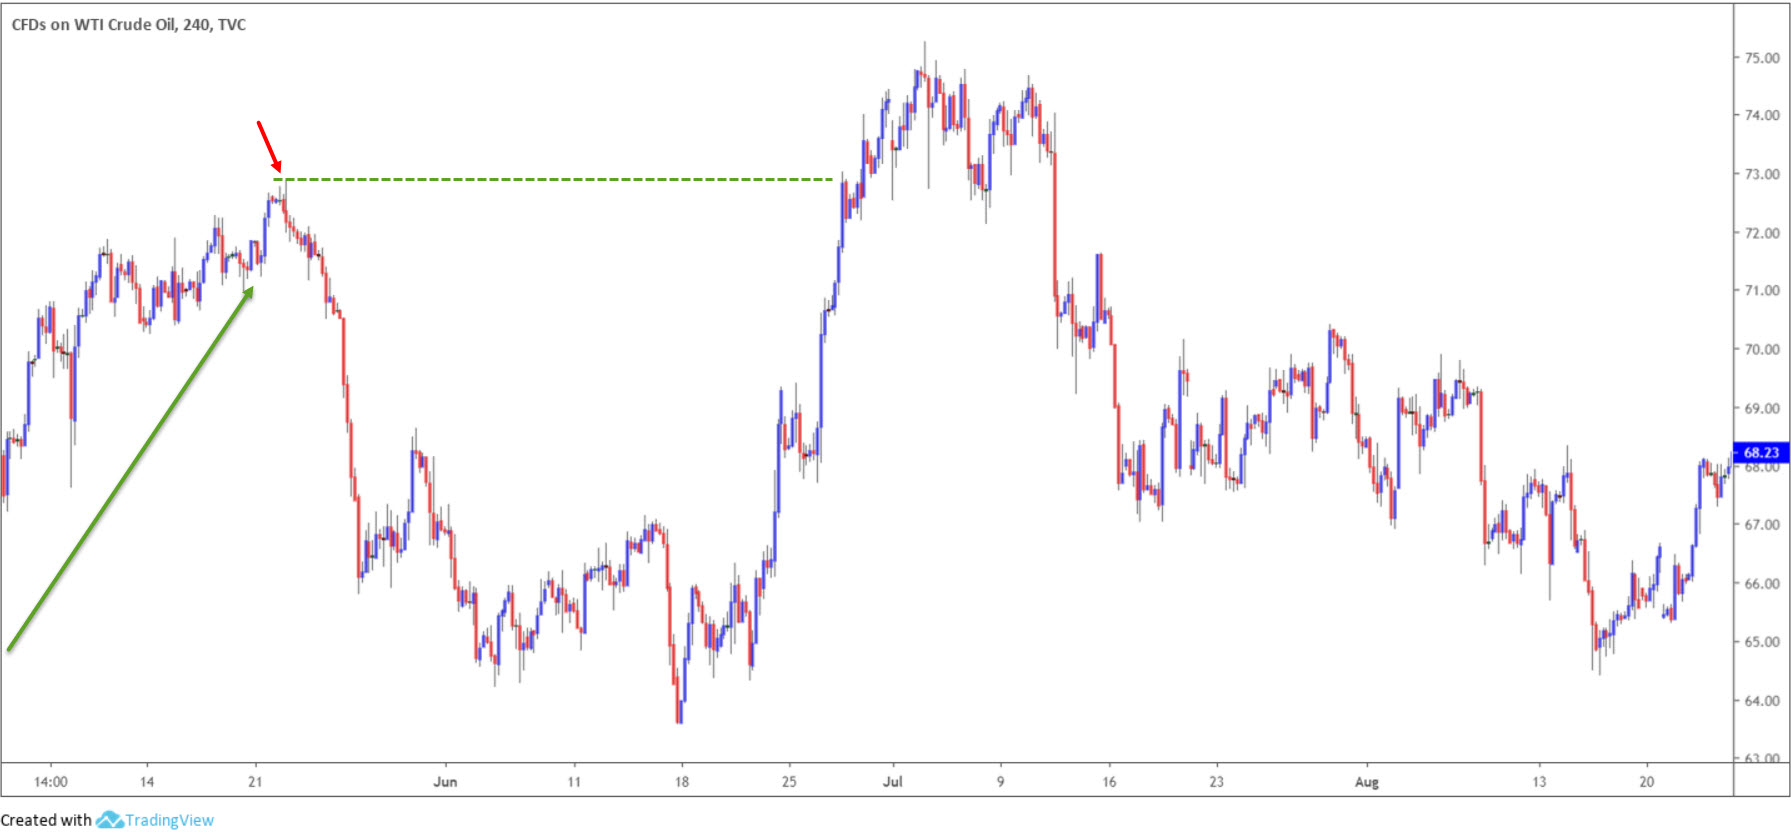
(Figure 1.2)
The next phase is to pinpoint the left shoulder, which, as you can imagine, is a pain, given each swing/pullback could effectively form a left shoulder. The key here is patience. Figure 1.3 displays the left shoulder at point 1.
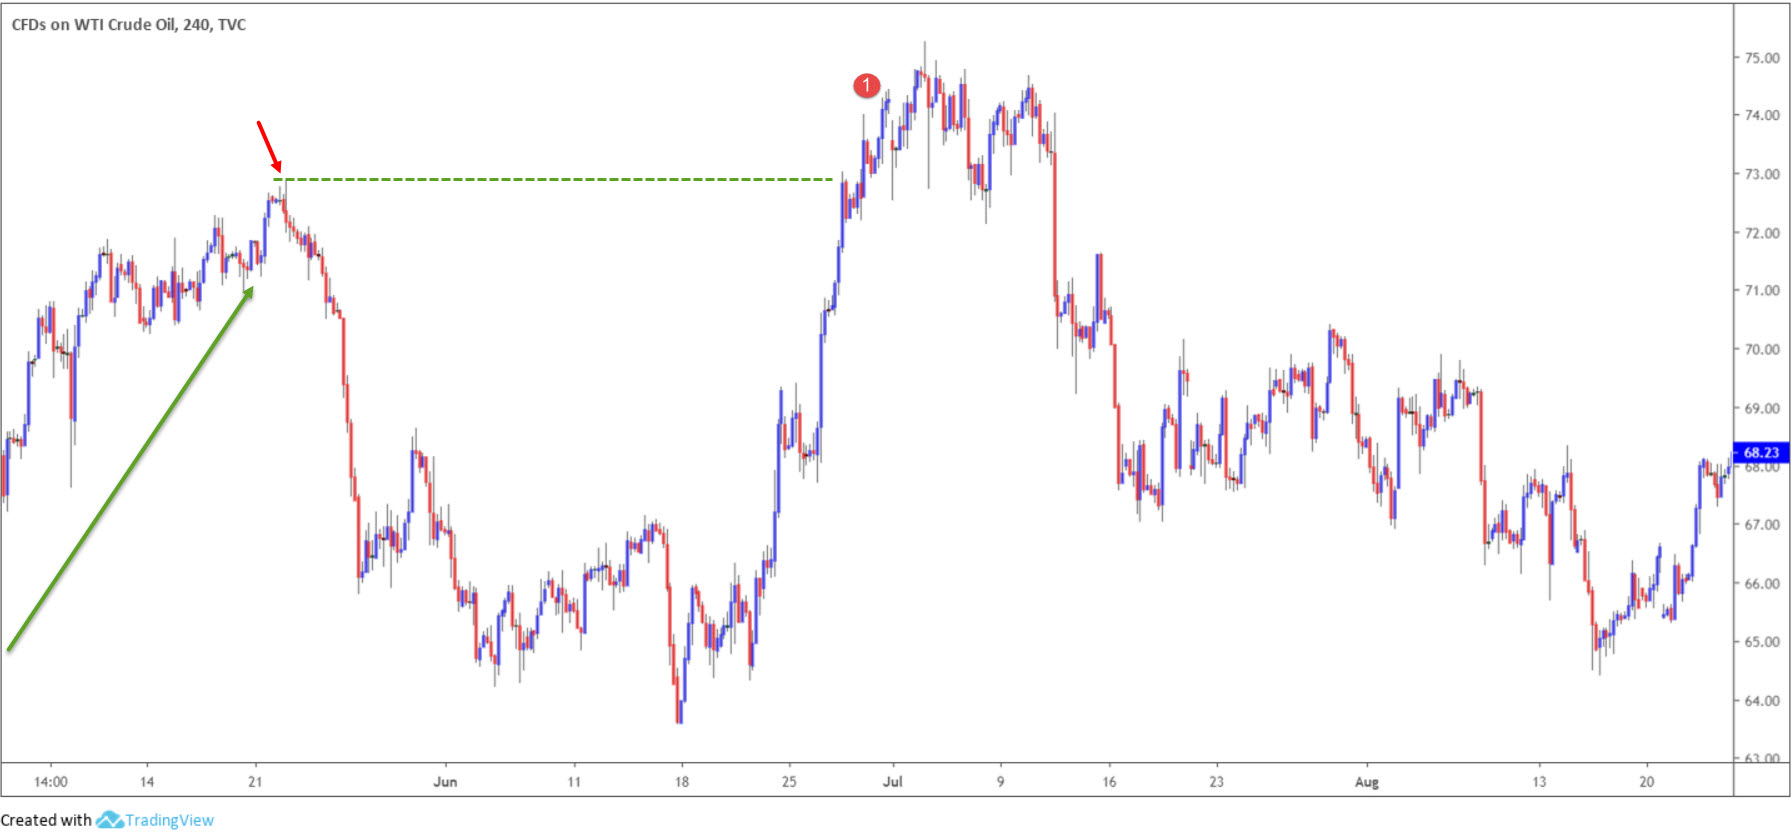
(Figure 1.3)
Once a potential left shoulder is visible, the head is the next point of interest, which formed at point 2, as presented in figure 1.4.
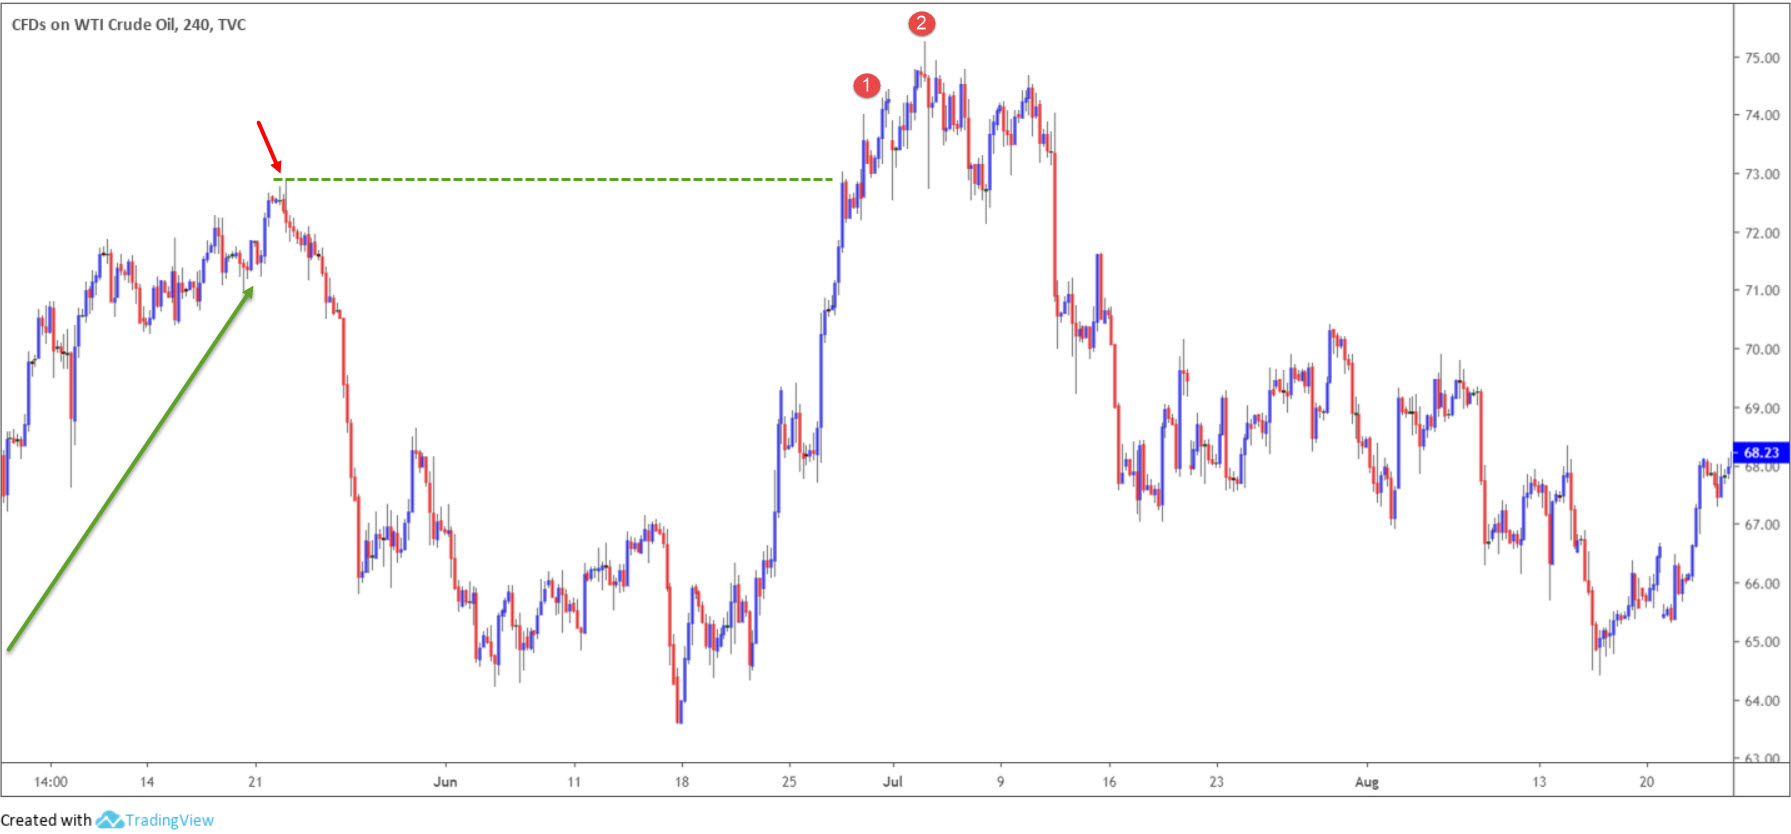
(Figure 1.4)
By this point, traders will look for the left shoulder to form, and this is where it gets interesting. Figure 1.5 shows a clear left shoulder formed at 3. The pattern is then confirmed (more on this later) on the large downside move through the neckline.
The bottoms between the peaks form a recognisable trend line (blue), which technicians call the neckline. Although the neckline is often horizontal, as in a support level or a resistance level, it can also be upward or downward sloping, as in the example below.
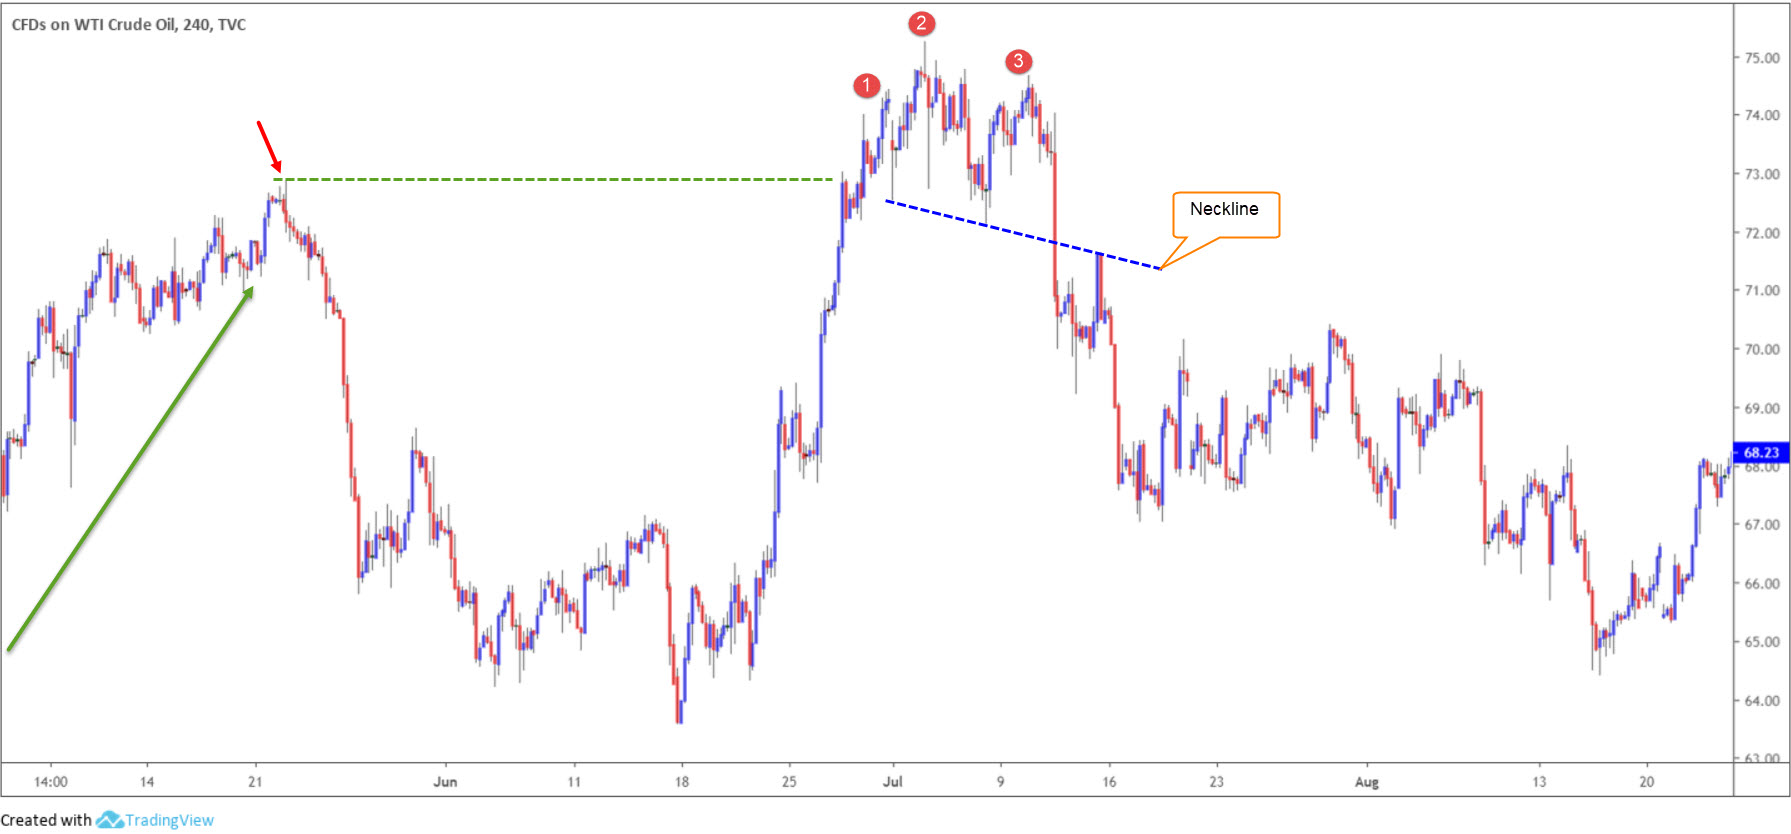
(Figure 1.5)
Trading
The neckline is the most important factor in the head and shoulders pattern: this is where the breakout level resides.
Although traders often attempt to anticipate the break of the neckline in order to get more bang for their buck, the risk of failure is too great and often leads to frustrating results.
Another point worth underlining is volume – a factor to watch for in exchange traded products. Typically, volume is higher on the rise into the first peak: the left shoulder. Thereafter, volume tends to decrease throughout the formation. The most important moment for volume occurs at the right shoulder. For a breakout to be considered valid an expansion of volume is often seen.
Two primary ways of trading the head and shoulders pattern is as follows:
- Buy/sell the breakout candle through the neckline.
- Wait and see if a correction to the neckline occurs.
The profit target calculates the distance between the head and the neckline, and projects it from the breakout price, as shown in figure 1.6 (black arrows). As is evident from the chart, price action swiftly achieved its price target upon breaking the neckline. The safer, more conservative, approach in this case, was to wait for the pullback to develop at 4 and enter short (sell).
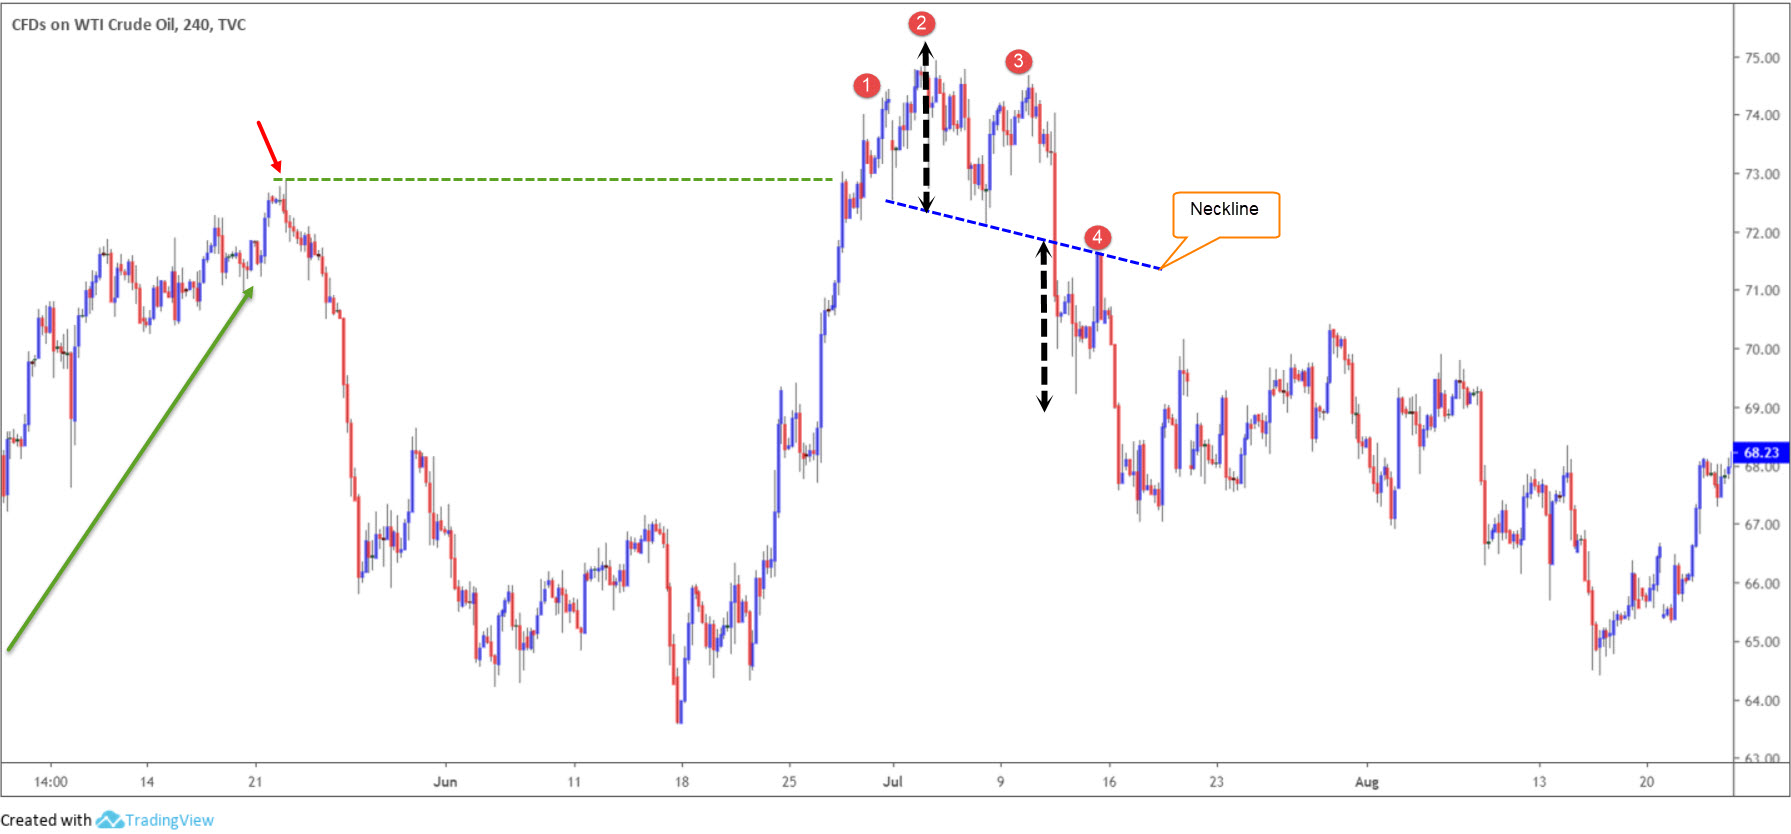
(Figure 1.6)
Conservative stop-loss placement tends to be above the right shoulder, though the risk/reward calculation generally offers not more than a 1:1 ratio, which by anyone’s gauge is not very much. It means you’ll have to win more than 50% of the time to profit, adding unnecessary pressure.
Stop-loss location is, of course, trader dependant. This is where additional technical tools help. For instance, some traders may choose to only trade a head and shoulders pattern if it forms alongside a moving average crossover, or aligns with a support and resistance level – the more confluence the better.
Trading with additional confluence allows the trader to locate protective stop-loss orders above/below surrounding structure: above resistance or below support, for example, therefore generally increasing risk/reward.
Trading mastery
Although the head and shoulder configuration is a high-probability pattern, successful trading is not just about following a pattern or analytical skill. If it were, there would be many more success stories.
Trading is a combination of skills. The discipline to follow the methodology, for example, is an important topic, and one that is rarely given much thought time. This is because traders assume following rules is the easy part, and in theory it should be. However, with hard-earned money on the line, emotions often override the rational side of the brain. An example of this is an impatient trigger finger, executing a position prior to price action closing beyond the head and shoulders pattern neckline.


