Currency pair EUR/USD
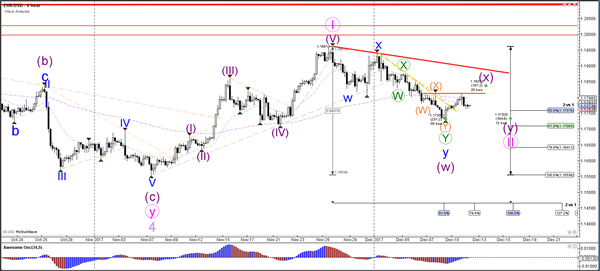
The EUR/USD bounce at the 50% Fibonacci level of wave 2 vs 1 could indicate the end of wave 2 (pink) but the retracement is rather short (see horizontal Fibonacci time levels 2 vs 1). An expansion of the wave 2 via a WXY (purple) is therefore possible and could indicate a potential bearish bounce at resistance (red).
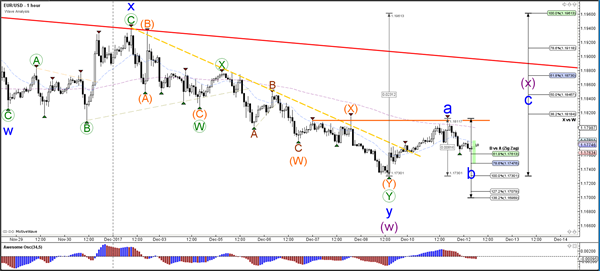
The EUR/USD could build a bullish ABC (blue) zigzag within wave X (purple). Price seems to be bouncing at the 61.8% Fib of wave B (blue) and could move towards the 61.8% Fib of wave X (purple).
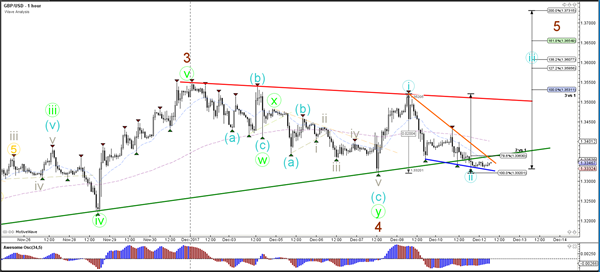
Currency pair GBP/USD
A GBP/USD break below the support (green) could still belong to a wave 4 (brown) as long as price does not break below the top of wave 1 (blue line). A bullish bounce could see price retest the resistance (red) but a breakout is needed before price is better positioned to complete the waves 5.
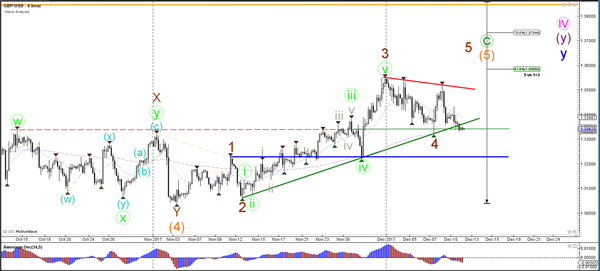
The GBP/USD would invalidate wave 2 (blue) if price breaks below the 100% Fib level of wave 2 vs 1. For the moment, price seems to be building a falling wedge chart pattern (orange/blue), which is a potential reversal signal.
Currency pair USD/JPY
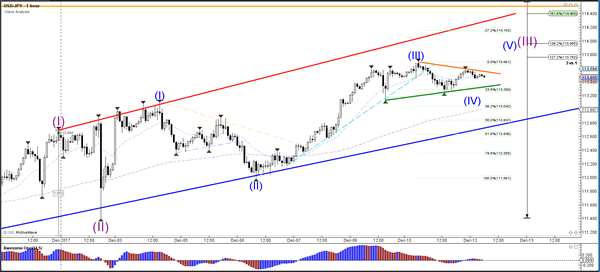
The USD/JPY could be a in wave 3 (purple) if price stays above the support trend line (blue). The alternative scenario is that price is building a wave C rather than a wave 3.
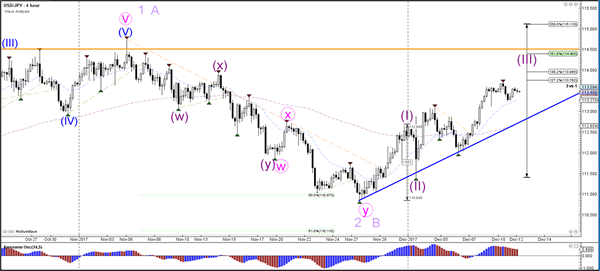
The USD/JPY is showing a triangle chart pattern which fits within the current wave 4 (blue) correction.