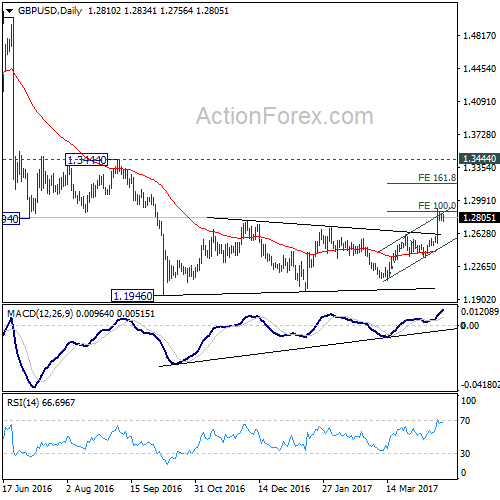
GBP/USD surged to as high as 1.2903 last week but retreated after hitting 100% projection of 1.2108 to 1.2614 from 1.2365 at 1.2871. Further rise is still expected in the pair. But price actions from 1.1946 are viewed as a corrective pattern. Hence we’d expect loss of momentum ahead to limit upside on next rise.
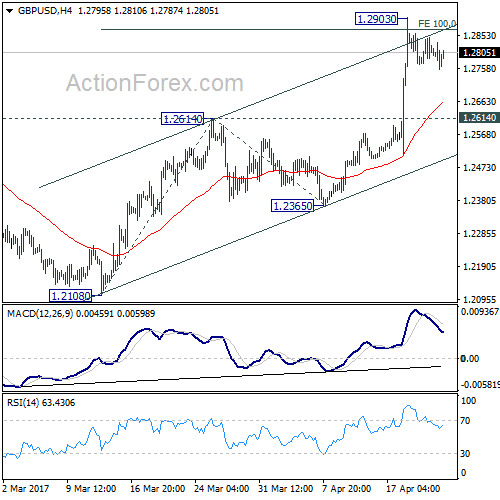
Initial bias in GBP/USD is neutral this week for consolidations. With 1.2614 resistance turned support intact, further rally is expected. Firm break of 100% projection of 1.2108 to 1.2614 from 1.2365 at 1.2871 will target 161.8% retracement at 1.3184. Still, price actions from 1.1946 are seen as a correction. Hence we’d expect strong resistance below 1.3444 to bring larger down trend resumption. On the downside, break of 1.2614 resistance turned support will turn bias back to the downside for 1.2365 support first.
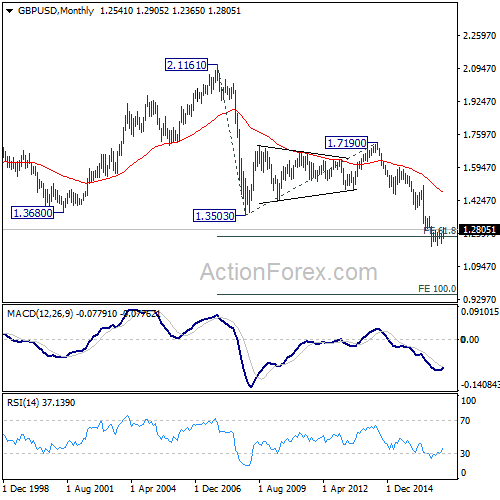
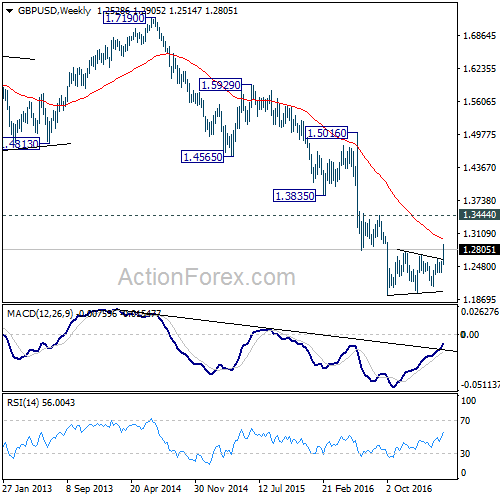
In the bigger picture, fall from 1.7190 is seen as part of the down trend from 2.1161. There is no sign of medium term reversal yet. Sustained trading below 61.8% projection of 2.1161 to 1.3503 from 1.7190 at 1.2457 will target 100% projection at 0.9532. Overall, break of 1.3444 resistance is needed to confirm medium term bottoming. Otherwise, outlook will remain bearish.
In the longer term picture, no change in the view that down trend from 2.1161 is still in progress. Current momentum suggests that the down trend will go deeper than originally expected to 100% projection of 2.1161 to 1.3503 from 1.7190 at 0.9532.