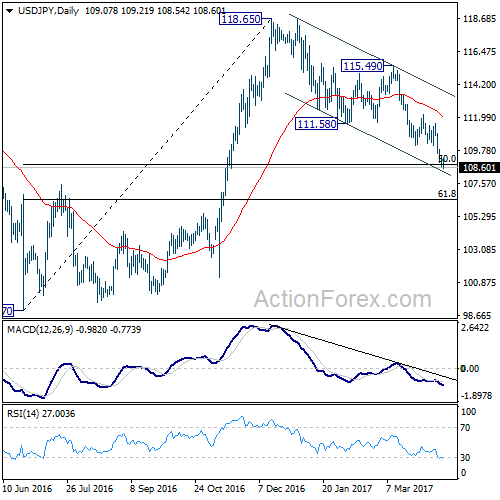
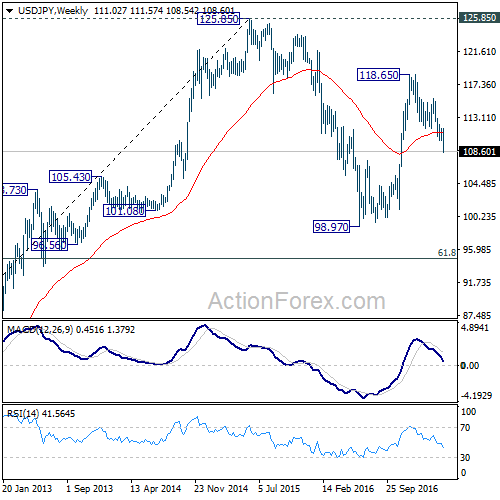
USD/JPY’s fall from 118.65 extended to as low as 108.52 last week. The firm break of 55 week EMA argues that rise from 98.97 is completed already. And deeper fall could be seen to 98.97 and below to extend the correction pattern from 125.85.
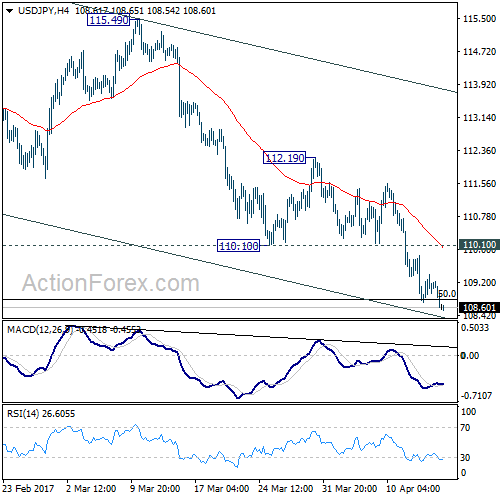
Initial bias in USD/JPY remains on the downside this week. Deeper fall would be seen to 61.8% retracement of 98.97 to 118.65 at 106.48. Sustained break there will pave the way back to 98.97 low. On the upside, break of 110.10 support turned resistance is needed to be the first sign of short term bottoming. Otherwise, outlook will remain mildly bearish in case of recovery.
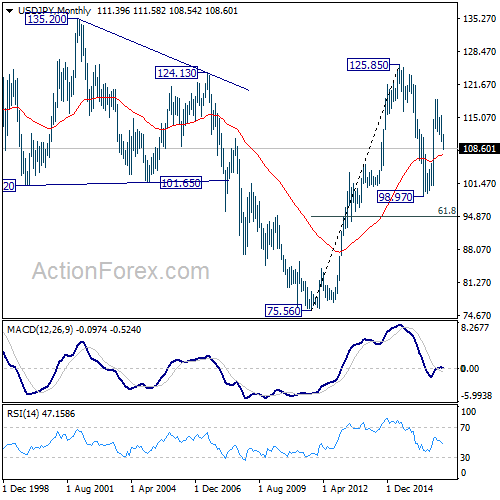
In the bigger picture, price actions from 125.85 high are seen as a corrective pattern. Current development suggests that it’s not completed yet and is extending. In case of deeper decline, downside should be contained by 61.8% retracement of 75.56 to 125.85 at 94.77 to bring rebound. Rise from 75.56 is still expected to resume later after the correction from 125.85 completes.
In the long term picture, the rise from 75.56 long term bottom to 125.85 medium term top is viewed as an impulsive move. Price actions from 125.85 are seen as a corrective move which could still extend. But, up trend from 75.56 is expected to resume at a later stage for above 135.20/147.68 resistance zone.