
Forex price action, as one might have guessed now is a rather broad term and is, in fact, an umbrella term with various approaches involved to trading with forex price action. In this article, we will outline a few forex price action techniques that are independent of your trading strategies or analysis but bound to help you improve or add confidence to your trade entry and exits. We make use of the Doji candlestick pattern which is one of the most commonly occurring candlestick price action setup.
The Doji Candlesticks
The Doji candlesticks are unique with their small or near flat body with long wicks on both the top and bottom and is one of the distinctive forex price action candlestick patterns that are formed. The Doji candlestick pattern, as we know denotes market indecision. Buyers are unwilling to push prices higher while sellers are unwilling to push price lower. Doji candlestick patterns are a great way to trade and can be very useful especially in the context of understanding what the market is doing.
Forex Price Action – Trading off Doji Support & Resistance
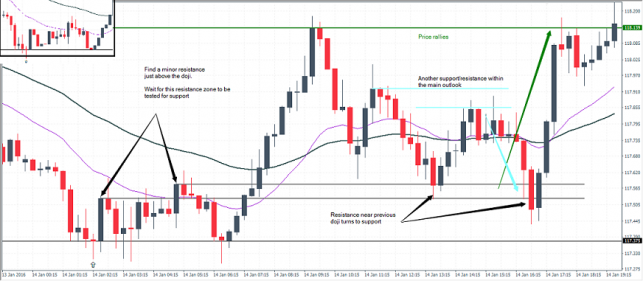
Conventional forex price action wisdom tells us that a Doji candlestick at the top or bottom of a strong trend signals a possible reversal. However, taken at face value, this nugget of wisdom can be disastrous. The first chart below shows the Doji candlestick being formed. However, notice how price repeatedly kept dipping back to the doji’s zone. For an inexperienced trader, taking a position at this doji set up would have resulted in getting their stop losses being hit repeatedly. Instead, identify a near-term support or resistance after the Doji is formed. Then wait for that support or resistance to flip and go long or short accordingly.
The chart below illustrates this example including a minor doji setup that was also formed.
forex price action
Forex Price Action – Doji trading method #1
Forex Price Action – Trading the doji high/low break
A second way to trade the Doji candlestick pattern with forex price action is to buy or sell on the break (with a closing price) above the high or the low of the Doji candlestick pattern, in the context of the trend. The chart below illustrates this second method.
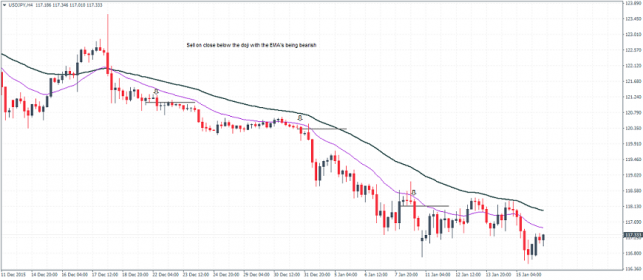
Selling on close below doji low
In the above chart, we have the EMA’s bearish. Price action shows various instances of the Doji candlestick pattern being formed. Taking a short position on the ‘close’ below the doji’s low within one or two candles shows a great way to trade the trend. Stops, in this method, are placed only on a closing price above the Doji high. In the second sell set up, notice how price spiked above the previous doji high but closed lower. Traditional stops would have been hit in what could have been a great trade ahead.
The next chart below shows a buy signal based on the doji’s high/low method.
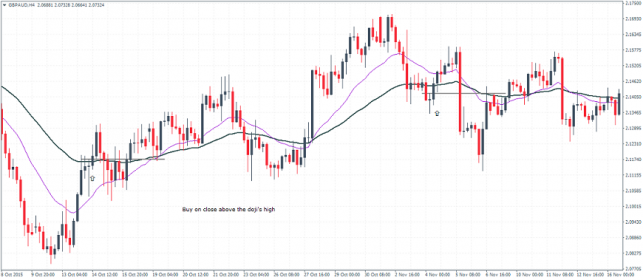
Buying on close above doji high
In the above chart, we have two examples of buying above the doji’s high on a close. To the left, the first forex price action signal shows a long entry. Note how prices continue to chop around near the doji’s low but prices never close below the doji’s low. Eventually, price action moves higher in a strong rally. The second example is one which shows a near text-book example with price closing above the doji’s high on the next candle resulting in a fairly decent price action movement to the upside.
Forex Price Action – Improving with doji candlestick patterns
The two methods outlined above are just one of the many examples for traders who want to experiment with trading forex price action. It is not only simple but also helps traders to be more confident in taking their trade setups.


