
When researching the Gartley pattern, one can come across many different versions, as different authors add their own “two-cents”. Newcomers to technical analysis may therefore have some difficulty identifying the original pattern itself as presented in 1935 by H.M. Gartley himself in his book Profits in the Stock Market, so for anyone interested — let me present it here! Please note that this pattern was developed originally for the stock market and requires volume indicators, which are not available in all markets — including foreign exchange.
Bullish Gartley Pattern
After a decline, as denoted by the long leg AB, the volume is drying up and the bulls find the low prices attractive. They aggressively enter the market with buy positions, pulling the market higher. This short-lived upward bounce (i.e. BC) is accompanied by expanding volume and inevitably terminates at point C. Since the bearish direction of the market remains intact and as supply is greater than demand, the market declines again as expected.
Buy Entry
More specifically, the decline is 33% – 50% of the BC segment. This is where the market finds support and a buy entry is in place, as suggested by the declining volume. Volume, where available, will give insights as to the strength/weakness of the movement. For example, at point B, volume will be drying up, whereas on the bounce up the segment BC will display expanding volume. This hints to the future direction of the market, as volume is a leading indicator. The buy entry is placed in anticipation that the market will eventually form an inverted Head & Shoulders or Double Bottom pattern once the price exceeds the last top at C. Gartley mentions that these are two of the most outstanding and most valuable reversals:
- Head & Shoulders (and its inverse)
- Double Top (and Double Bottom)
- Rounding
- Broadening
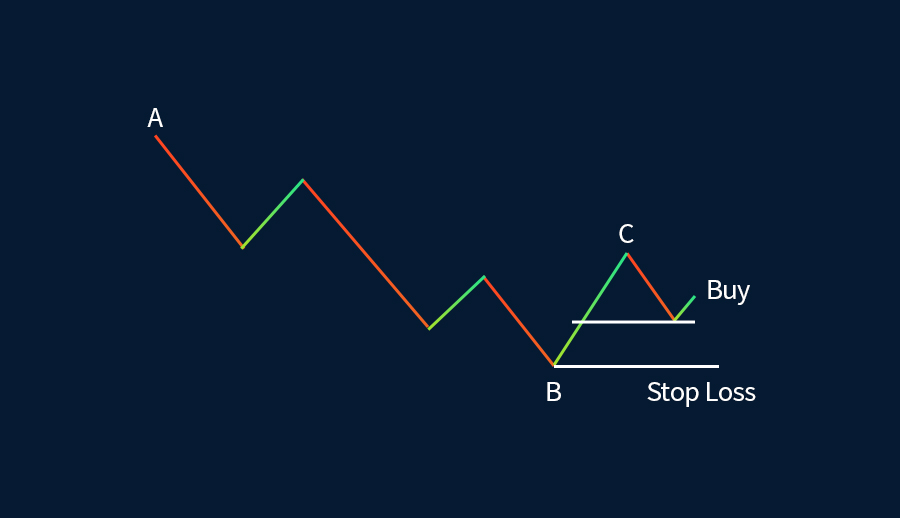
Another buy entry opportunity is seen at point C when the market exceeds the corresponding top. This is an Inverse Head & Shoulders or Double Bottom entry.
Stop Loss
No trading system is complete without risk management rules and, more specifically, a protective stop loss to cater for unexpected price moves after the entry. The stop loss is placed strategically below point B, where any possible price move would invalidate the bullish pattern.
Take Profit
Employing the minimum price target/objective common in the Inverse Head & Shoulders and Double Bottom reversals, the height from B to C will be projected to point C. A trailing stop may be used at subsequent bottoms to protect the potential profit.
Bearish Gartley Pattern
After a rally, as denoted by the long leg AB, the volume is drying up. Bears find the high prices attractive and they aggressively enter the market, with sell positions pushing the market lower. This short-lived downward rebound (i.e. BC) is accompanied by expanding volume, and inevitably terminates at point C. Since the bullish direction of the market remains intact and as demand is greater than supply, the market — as expected — rallies again.
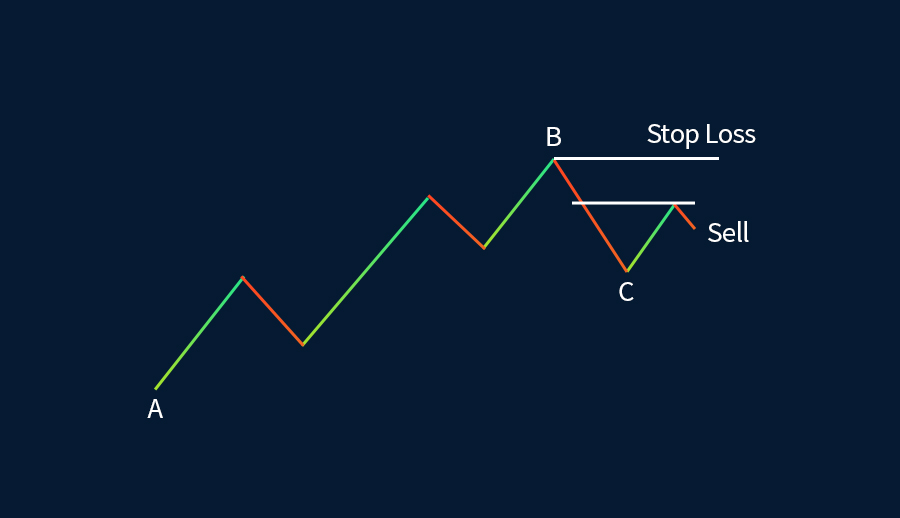
Sell Entry
More specifically, the short-lived rally from point C, is 33% – 50% of the BC leg. This is where the market finds resistance and a sell entry is in place as hinted by the declining volume. Volume at point B will be drying up, whereas on the rebound, the segment BC will display expanding volume. This hints to the future downward direction of the market. The sell entry is placed in anticipation that the market will eventually form a Head & Shoulders or Double Top reversal. Additionally, another sell entry opportunity is seen at point C when the market dips the corresponding bottom, forming a Head & Shoulders reversal or Double Top.
Stop Loss
Once more, a protective stop loss is imperative to help protect the trader’s capital. The stop loss is placed strategically above point B, where any possible price move would invalidate the bearish pattern.
Take Profit
The minimum price target/objective common in the Head & Shoulders and Double Top reversals, the height from B to C, will be projected to point C. A trailing stop may be used at subsequent tops to protect the potential profit.
Conclusion
The original Gartley pattern may be seen as similar to the ABC correction found in Elliott Wave Theory. Gartley mentions an exact range (33% – 50%) of the counter move from point C before the entry into the market. Stop loss is imperative, and trailing stop loss can be employed to protect the profits.


