EUR/CHF : 1.1643
The single currency has continued moving higher after recent anticipated rise from 1.1388 and previous resistance at 1.1624 was finally breached, add credence to our view that recent upmove has resumed and bullishness remains for medium term uptrend to extend further gain to 1.1695-00 (61.8% projection of 1.0833-1.1538 measuring from 1.1259) and possibly towards 1.1790-00, however, this wave v is likely to be limited to1.1860-70 and price should falter well below 1.2000, bring correction later.
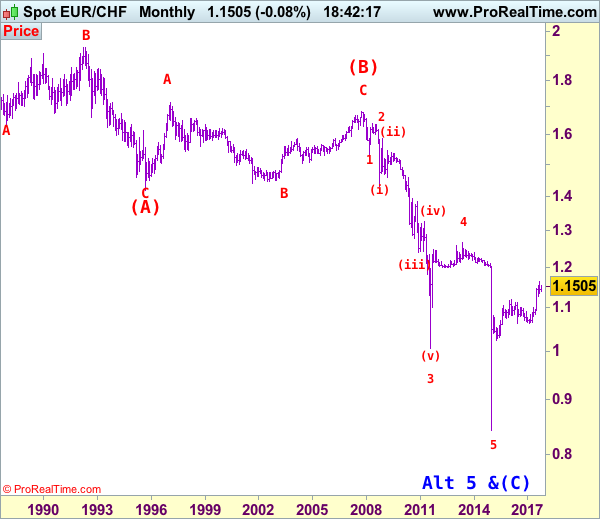
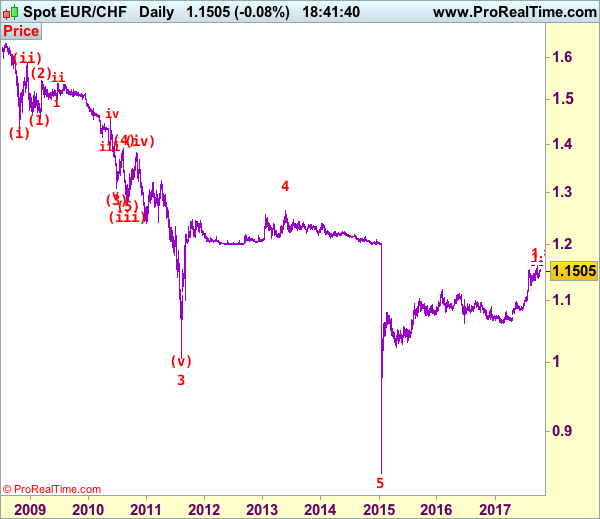
To recap our preferred count, the decline from 1.6828 (end wave (B)) is labeled as the beginning of wave (C) which should unfold as an impulsive move with 1: 1.5326, 2: 1.6377 and wave 3 is sub-divided into (i): 1.4300, (ii): 1.5880 and wave (iii) is still unfolding with (1): 1.4577, (2): 1.5448 and wave (3) is an extended 3rd with i: 1.5006, ii: 1.5383, wave iii: 1.3073, then wave iv ended at 1.3925 and wave v at 1.3073, wave (4) ended at 1.3925 and wave (5) has ended at 1.2765 which also marked the low of wave (iii) and wave (iv) has ended at 1.3835 and wave (v) as well as larger degree wave 3 has ended at 1.0075. The selloff from 1.2650 signals wave 4 has ended there and we are taking a view that the wave 5 could also have ended 0.8426, hence consolidation is seen with mild upside bias for rebound to 1.1400 (already met), then towards 1.1600.
On the downside, whilst initial pullback to 1.1600 cannot be ruled out, reckon 1.1570 would limit downside and bring another rise later. Only a drop below support at 1.1488 would defer and risk pullback to 1.1425-30, then towards support at 1.1388 which is likely to hold from here. In the unlikely event euro drops below said support at 1.1388, this would signal a temporary top has been formed and bring retracement of recent rise to 1.1345, then towards another previous support at 1.1259 which is likely to hold from here.
Recommendation: Buy again at 1.1580 for 1.1780 with stop below 1.1480.
The long-term downtrend started from 1.9626 (Apr 1985) to 1.4166 (Sep 1995) is treated as wave (A) with A:1.6285 (Dec 1987), B: 1.9342 (May 1992) and C: 1.4166, then wave (B) ended at 1.6828 with A: 1.7147 (Feb 1997), B: 1.4398 (Sep 2001), C: 1.6828 (Nov 2007), therefore, wave (C) is now in progress with the breakdown indicated as above. This wave (C) already met indicated downside target at 1.1455/60 and 1.1300, it could have ended at 0.8426, consolidation with mild upside bias is seen for gain to 1.1000 and later towards 1.2000.