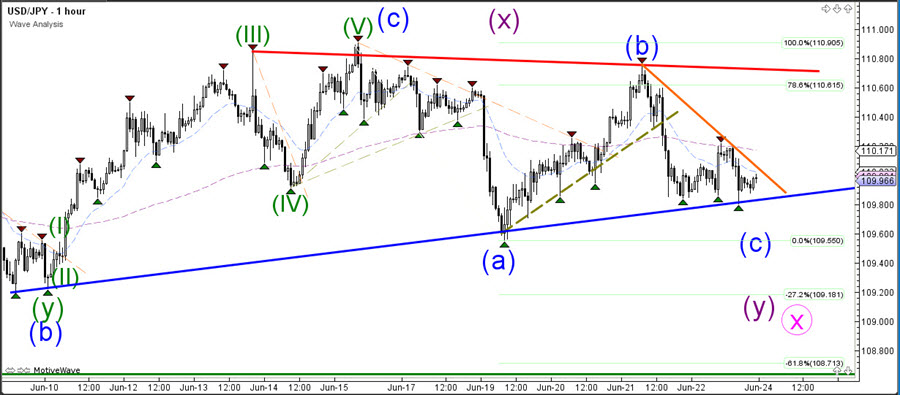
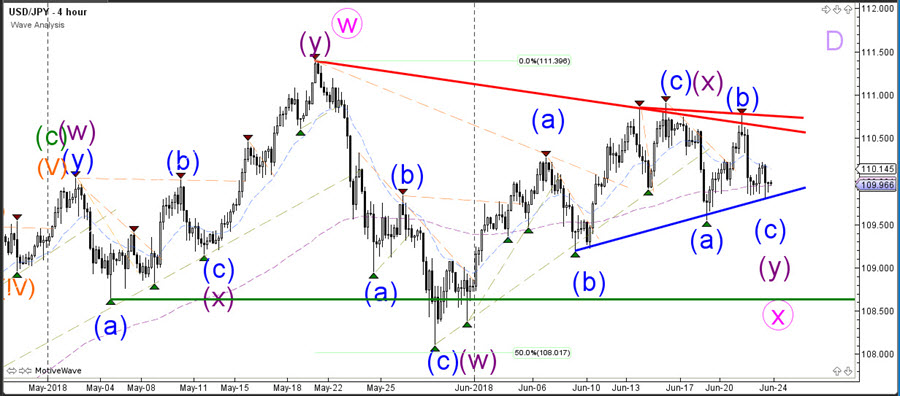
The USD/JPY remains in a triangle chart pattern for the moment. A break below the support trend line (blue) could indicate a deeper correction within wave X (purple) whereas a break above the resistance trend line could end of wave X and start a bullish correction of wave D (purple).
The USD/JPY is building a consolidation pattern around the support trend line (blue) which is a key bounce or break spot. A bearish breakout seems more likely at the moment due to the bearish structure of the price patterns and could signal a continuation towards the Fibonacci targets on this chart.