

HomeContributorsTechnical AnalysisElliott Wave Analysis: USDZAR and Crude Oil Beautiful Patterns

Elliott Wave Analysis: USDZAR and Crude Oil Beautiful Patterns

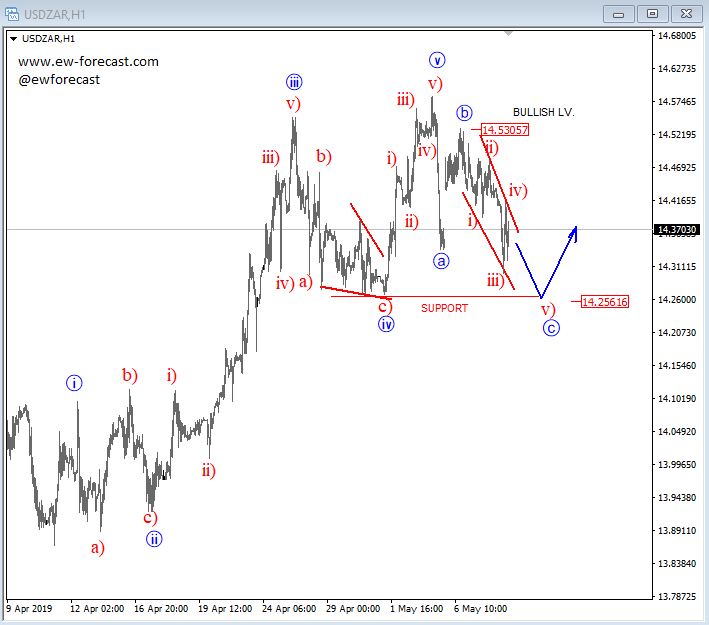
USDZAR is trading bullish but currently price may slow down in an a-b-c correction, where ideal support would be around previous wave »iv« and 14.25 level. But, any earlier strong rise back above 14.53 region would be an indication of a completed correction within uptrend.

USDZAR, 1h
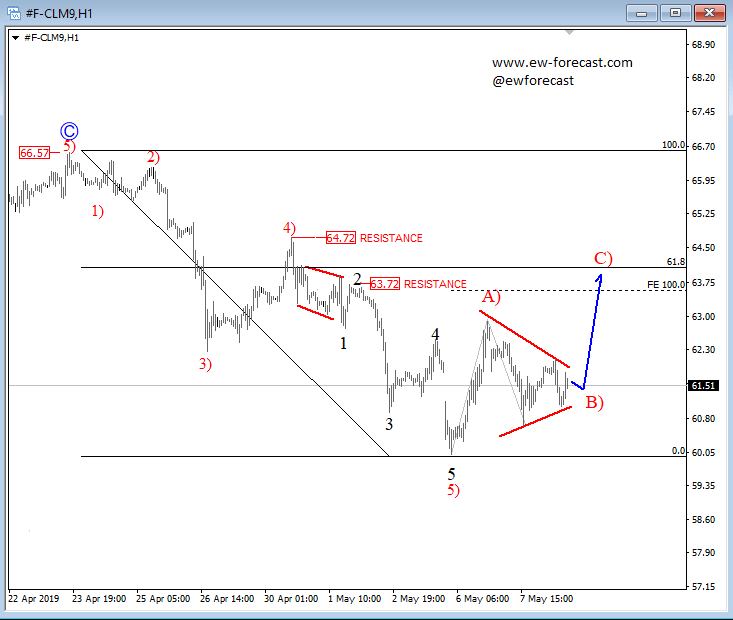
OIL can be finishing a small bullish triangle in wave B) that can send the price towards 61,8% Fibo. retracement and 63.70 – 64.70 resistance area for wave C), where a bigger three-wave correction within downtrend may come to an end.

Crude oil, 1h
Get daily and weekly ActionForex analysis and key releases on our Telegram channel.

Elliott Wave Financial Service
Elliott Wave Financial Servicehttp://www.ew-forecast.com/
Trading forex, futures or futures options carries a high level of risk, and may not be suitable for all investors. The possibility exists that you could lose some or all of your initial investment; therefore you should not invest money that you cannot afford to lose. Our website and the information provided here should not be relied upon as a substitute for extensive independent research before making your investment decisions.

Latest Analysis

Learn Forex Trading