EUR/USD
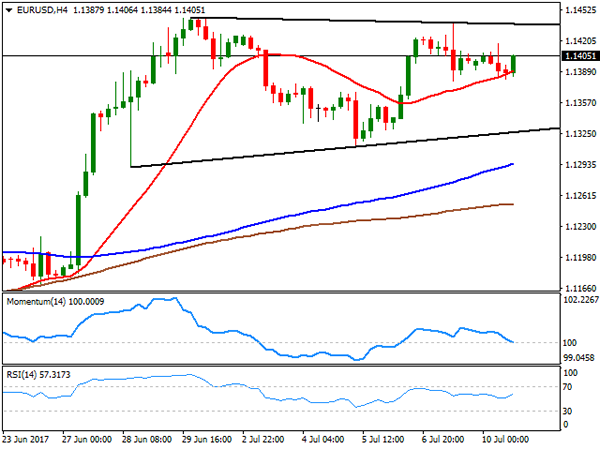
The EUR/USD pair closed the day pretty much unchanged, a couple of pips above the 1.1400 level, with a quiet macroeconomic calendar keeping major pairs within limited intraday ranges, ahead of bigger events that will take place later this week. Minor figures released in Europe reaffirm healthy economic growth in the region, as German’s May seasonally-adjusted trade surplus rose to €20.3bn, from €19.7bn in April, with exports and imports more than doubling expectations in the same month. For the whole EU area, the Sentix investor confidence index for July resulted at 28.3, slightly below the expected and previous 28.4. In the US, the June labor market conditions index rose 1.5%, below previous 2.3% and the expected 2.3%, up for 13th consecutive month. Despite Tuesday’s macroeconomic calendar will be quite busy, there’s no first-tier data scheduled until next Wednesday, when the UK will release its latest employment figures, and Fed’s Yellen will testify before the US Congress.
Technically, the pair continues consolidating near this year high, although having retreated for the 1.1440 region where it topped the last two weeks, with investors rushing to take profits on approaches to the 1.1460 area, as the pair has remained below this last with a couple of short-lived exceptions, since January 2015. The short term technical picture is neutral-to-bullish, as in the 4 hours chart, the price held above a bullish 20 SMA, with the Momentum indicator heading lower around its 100 level and the RSI hovering around its 50 level. Beyond the mentioned 1.1460 resistance, the pair has scope to extend its gains up to 1.1520/30 price zone, while the risk will turn towards the downside only with a break below 1.1290.
Support levels: 1.1380 1.1340 1.1290
Resistance levels: 1.1460 1.1490 1.1525
USD/JPY
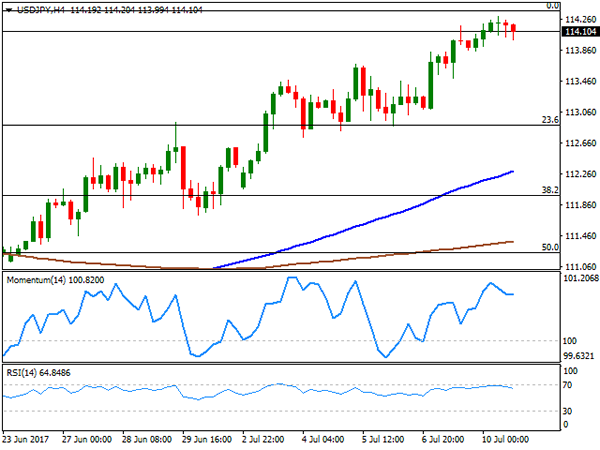
The USD/JPY pair settled above 114.00 for the first time in almost two months, having traded as high as 114.29 following BOJ’s Governor Kuroda dovish stance on monetary policy, as he pledged to maintain the ongoing easing programs as long as needed to achieve a 2% inflation target. JPY losses were limited by retreating Treasury yields, as a couple of ECB’s members indicate that there’s no rush to retrieve the ongoing QE program in the EU, with Peter Praet saying that "we still need a long period of accommodative policy before we are ready,” triggering a bounce in government bonds. The US 10-year note yield eased to 2.38% from previous 2.39%, still holding near two-month highs and not enough to send the pair lower. Technically, the 4 hours chart shows that technical indicators have retreated modestly from near overbought readings, lacking anyway bearish strength, whilst the price remains well above bullish 100 and 200 SMAs, with the shortest accelerating above the largest. The pair needs to advance beyond 114.40 to be able to extend its gains, up to 115.10 as an initial bullish target.
Support levels: 114.00 113.60 113.10
Resistance levels: 114.40 114.75 115.10
GBP/USD
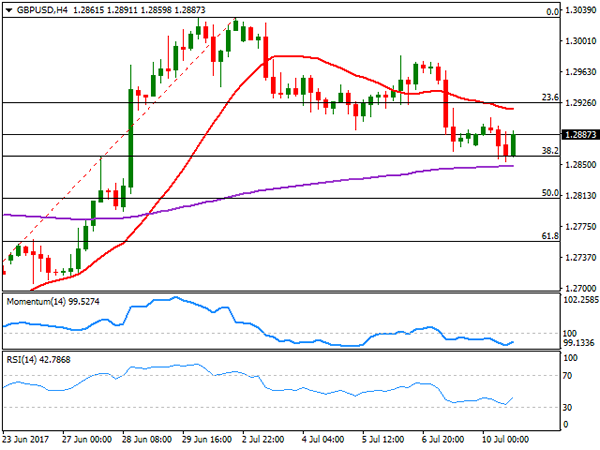
The GBP/USD pair fell to its lowest in two weeks early London, printing 1.2853 before bouncing, to close the day unchanged at the 1.2880 region. In the news, PM Theresa May called for more cross-party cooperation in pushing though Brexit legislation, getting mocked by Labour Corbyn, who said that if she is running out of ideas, she should read the party’s manifesto. May’s position as leader of the UK has weakened ever since the election, and her ability to run the kingdom is still in doubt, despite allying with the DUP. The news have not affected the Pound so far, but indeed added to the negative tone of the GBP. In the macroeconomic front, a couple of MPC members will hit the wires on Tuesday, while UK employment data will be released on Wednesday. From the technical point of view, the 4 hours chart shows that the price continues developing below a bearish 20 SMA, this last around 1.2920, while technical indicators have bounced modestly within negative territory, maintaining the risk towards the downside. The same chart shows that the price held above the 38.2% retracement of the latest daily advance at 1.2860, the level to break to confirm additional declines ahead.
Support levels: 1.2860 1.2820 1.2785
Resistance levels: 1.2925 1.2960 1.3000
GOLD
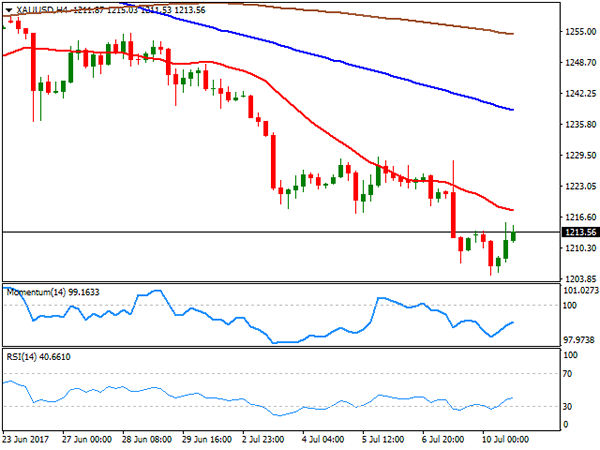
Spot gold fell to $1,204.75 a troy ounce, its lowest since mid-March, to close the day barely positive at 1,213.50, helped by the soft tone of the American currency during the US afternoon. Still, the safe-haven commodity has lost market’s favor as major central banks’ are considering shifting their monetary policies towards tightening. Additionally, the COT report released on Friday showed that speculative interest kept dumping metals for a fourth consecutive week. Technical readings maintain the bearish stance in the daily chart, as the price remained well below all of its moving averages, the Momentum indicator maintaining its downward slope within negative territory, and the RSI indicator holding within oversold levels. Shorter term, the outlook is also bearish according to the 4 hours chart, as a bearish 20 SMA keeps leading the way lower, whilst technical indicators resumed their declines within negative territory after correcting oversold conditions reached earlier on the day.
Support levels: 1,204.75 1,194.95 1,188.20
Resistance levels: 1,222.10 1,228.00 1,236.50
WTI CRUDE OIL
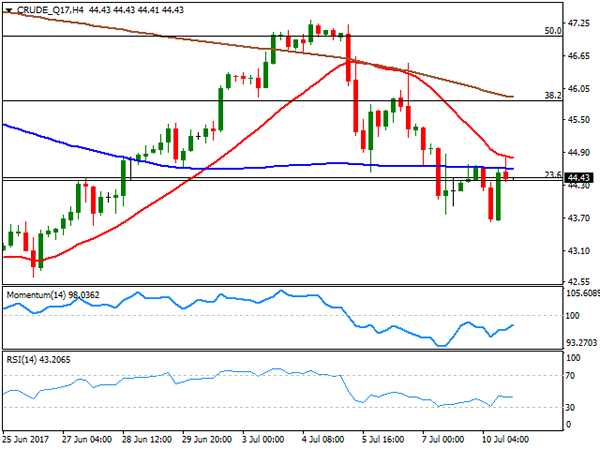
West Texas Intermediate crude oil futures settled at $44.40 a barrel, barely changed intraday, but bouncing from a daily low of 43.64, with news that the OPEC has invited Libya and Nigeria to join a meeting with other major producers later this month, capping the decline. Hopes that the two now exempted countries can join the output cut, however, have not been enough to attract buyers. The daily chart shows that the commodity met selling interest around a flat 20 DMA, while the Momentum indicator have turned modestly lower within positive territory, whilst the RSI indicator continues to lack directional strength below its 50 level, leaning the scale towards the downside. In the 4 hours chart, the upward potential is also limited, as WTI stands below its moving averages, while technical indicators have lost directional strength within negative territory, following a bounce form oversold readings.
Support levels: 43.70 43.10 42.60
Resistance levels: 44.80 45.50 46.10
DJIA
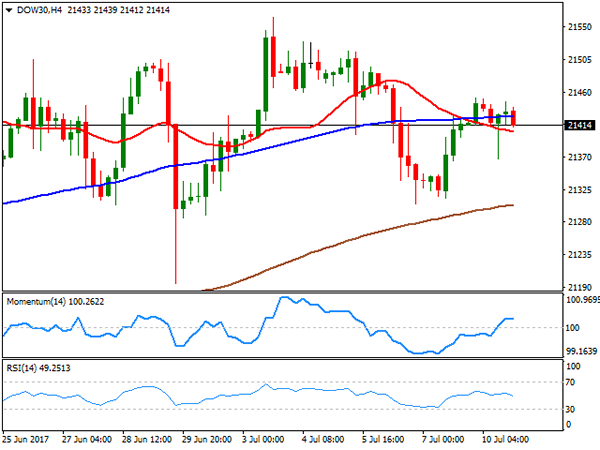
Wall Street closed little changed, with the Dow Jones Industrial Average down 6 points, to 21,408.52, and the S&P adding 0.09%, to 2,427.43. The Nasdaq Composite added 23 points or 0.38% and closed at 6,176.39, backed by a bounce in the tech sector. Trading volumes were low as caution prevailed ahead of US inflation readings and Yellen’s testimony before the Congress. Within the DJIA, Visa led advancers, adding 1.51%, followed by Nike that closed 1.25% higher. Wal-Mart shed 2.61%, leading losers’ list, while Home Depot shed 0.71%, as Best Buy sunk 6%. The index remains neutral daily basis, as it settled around a now horizontal 20 SMA, whilst technical indicators head nowhere around their mid-lines. In the 4 hours chart, the index is stuck between its 20 and 100 SMAs, while technical indicators turned lower, with the RSI indicator at 48, somehow leading the scale towards the downside.
Support levels: 21,366 21,305 21,278
Resistance levels: 21,459 21,515 21,563
FTSE100
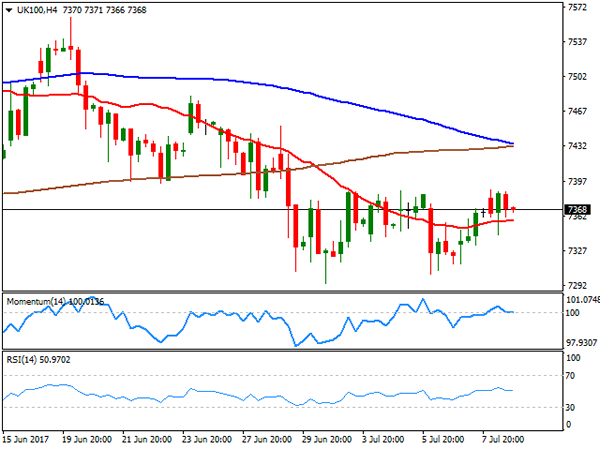
The FTSE 100 ended the day with modest gains at 7,370.02, up 19 points or 0.26%, reverting early losses as the mining-sector edged higher after an early dip, and as the Pound maintained the sour tone. Volumes were along across the region, amid the absence of a fundamental catalyst and as investors wait for earnings reports. The best performer was Schroders, which added 2.15% while big names of the mining sector, including Anglo American, Randgold Resources and Glencore added over 1.0% each. In the losing side, Shire led with a 3.19% decline, followed by Next that ended 1.94% lower. In the daily chart, the index settled right below its 100 DMA, whilst the 20 DMA extended its decline above it, as technical indicators keep hovering within bearish territory, with the RSI flat around 45, which keeps the risk towards the downside. In the shorter term, the pair remains neutral according to the 4 hours chart, having ended the day a few points above a horizontal 20 SMA, and technical indicators heading nowhere around their mid-lines.
Support levels: 7,327 7,294 7,256
Resistance levels: 7,386 7,424 7,452
DAX
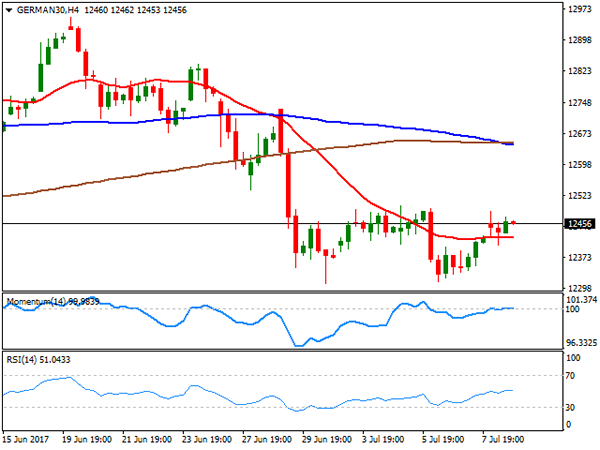
European indexes advanced at the beginning of the week, gaining on strength in the mining and energy-related sectors, backed by an advance in oil. The German DAX closed the day at 12,445.92, up 57 points or 0.46%, helped by surging exports in the country, according to the latest trade balance data. Most members were up, with E.ON leading gainers, up 2.11%, followed by Linde that added 1.69%. ProSiebenSat.1 led decliners once again, down 0.96%, followed by Adidas that shed 0.48%. The daily chart for the index shows that it held below last week’s high, still struggling above its 100 DMA and below a bearish 20 SMA, whilst technical indicators have lost downward strength, but hold within negative territory, limiting chances of a steeper recovery. In the 4 hours chart, the technical outlook is neutral, as technical indicators turned flat around their mid-lines, whilst the benchmark settled above a horizontal 20 SMA, but still below the 100 and 200 SMAs, both converging around 12,650, in line with the longer term perspective.
Support levels: 12,432 12,390 12,333
Resistance levels: 12,490 12,536 12,581