
Observing sharp moves form in the foreign exchange market followed by periods of consolidation is common viewing.
The problem traders have, though, is deciphering whether the pause in market price is the beginnings of a reversal, or a pullback before proceeding on its initial course.
A chart pattern that places a framework around this type of movement is the bullish or bearish pennant formation.
The framework
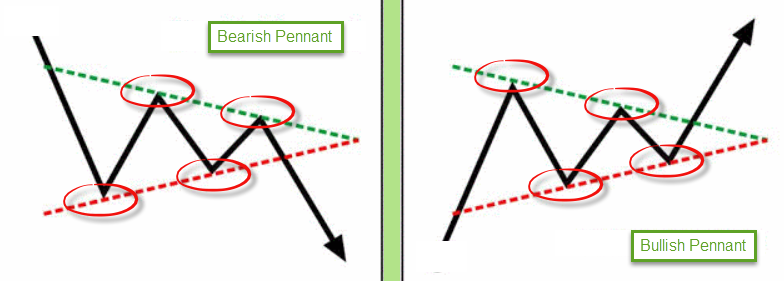
The pennant contains three elements and is a continuation pattern.
The first piece is a ‘flag pole’, representing a decisive move in either direction. As a pattern develops, a brief consolidation moulded in the form of a pennant by way of a symmetrical triangle takes shape: two converging trend lines. The final part of the sequence, assuming the formation completes, is a continuation in the direction of the initial move, usually at the length of the flag pole.
The image below should help clear up any confusion:
The psychology behind the pattern is relatively straightforward.
Following a sharp increase or decrease in activity, a number of traders tend to liquidate their positions as they feel price is likely to reverse after such a move. The flip side to this, however, is there will also be another portion of the market looking to join the trend phase, believing recent movement is simply a pullback before continuing higher/lower. This is likely what causes the flagging motion. In other words, it is a balance between buyers and sellers or bids to offers.
As soon as this balance unsettles, price will take the path of least resistance: the market will either complete the pennant formation by breaking the opposing edge and continuing on its original path, or reverse and fail to complete. The former allows traders a potential high-probability entry into the market, typically offering favourable risk/reward scenarios.
Trading strategies
Although the pennant configuration is a high-probability setup, rules dictating entry and exit are essential.
For folks new to the world of technical analysis and price action, below are a couple of techniques traders actively employ in the market.
The breakout play:
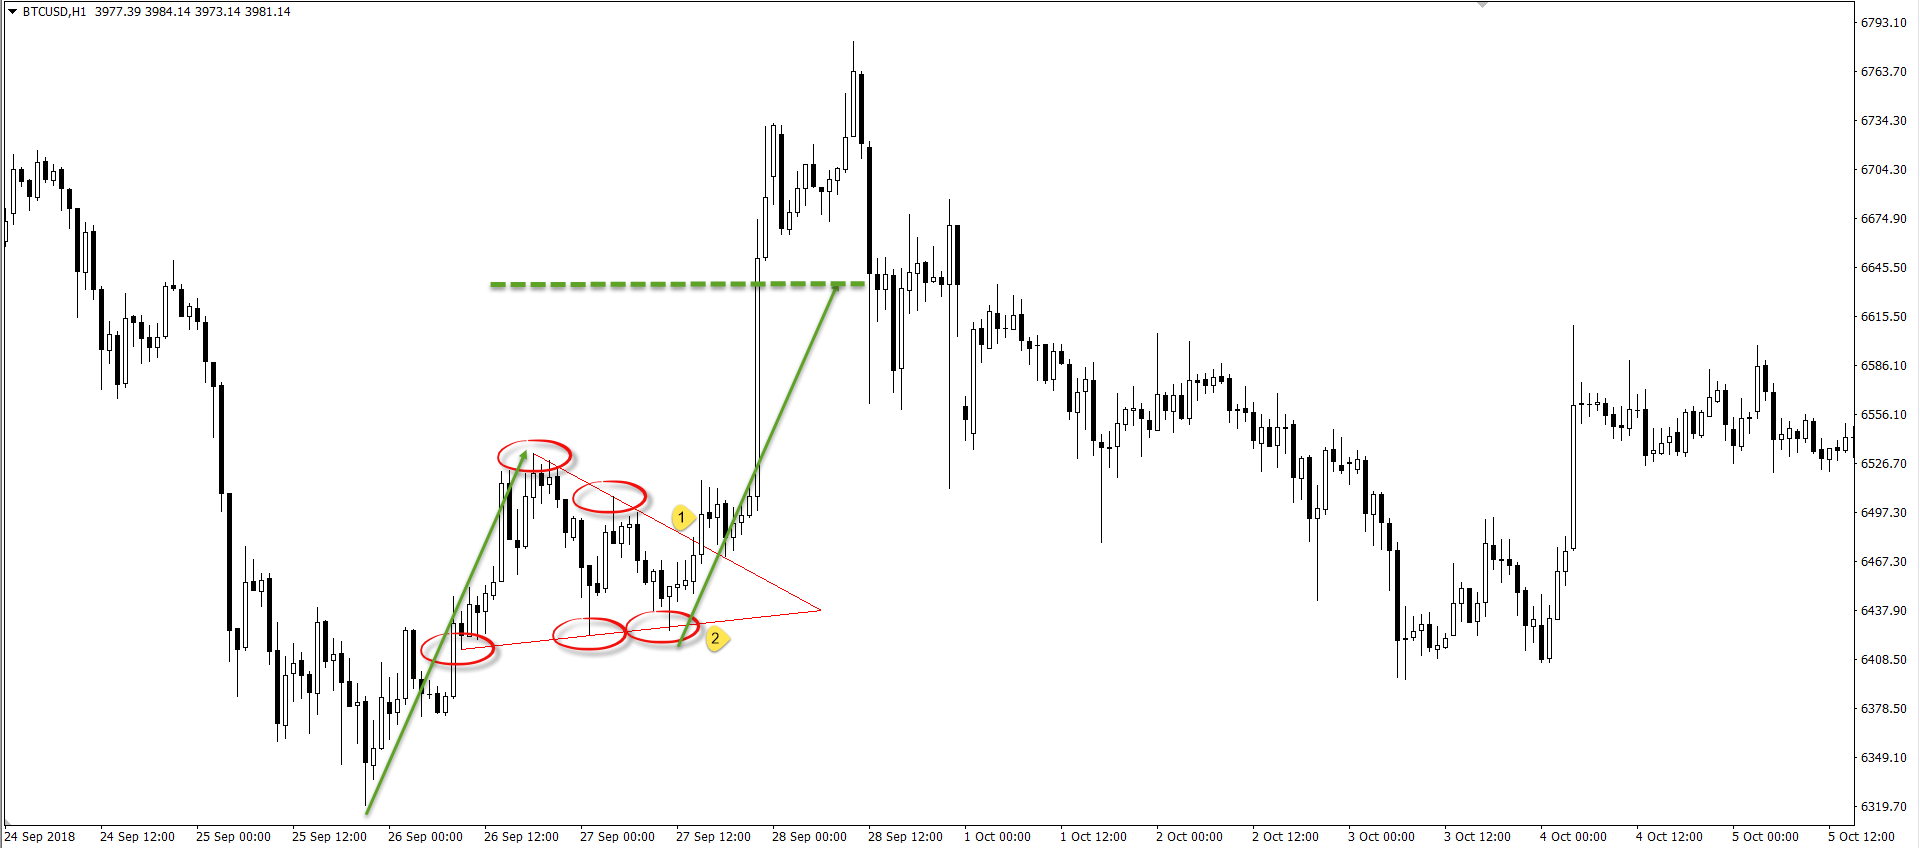
Using the H1 BTC/USD chart below, traders are able to observe a bullish pennant formation that completed flawlessly.
One way of attacking this pattern is to wait for a breakout candle to occur.
At point one, price broke free of its consolidation and closed in reasonably strong fashion to the upside. This, for some traders, is sufficient enough to take action: a long entry at the close of the breakout candle, with stop-loss orders tucked either beneath the breakout candle’s tail or beneath the pennant edge (point 2).
As for the take-profit target, the general rule of thumb is the breakout typically moves an equal distance to the original move (green arrows).
The breakout/retest play:
Using the same chart posted above, an alternative method of trading the pattern is to wait for a retest to form following the breakout. This helps avoid falling victim to a fakeout, and is, according to most traders, considered more of a conservative approach.
Should traders elect to use this setup, entry is generally seen after the retest has taken shape (point 2) on the next available candle (point 3), with stop-loss orders placed beneath the opposing edge of the pennant (point 4).
Concerning the take-profit level, traders will similarly look to target an equal distance of the original move (green arrows).

Some advantages of trading the pennant pattern:
- To trade this pattern no technical indicators are required, though some traders do employ the use of indicators and price action based structure as forms of confirmation to help validate the pattern.
- Since it is a continuation pattern, it offers trading opportunities to enter within trending environments.
- The pattern forms on all timeframes, therefore allowing day traders, swing traders and position traders the opportunity to use the configuration to profit.
- The risk/reward ratio tends to offer at least 1:3 if traded in the fashion stated above. As a result, an occasional loss should not cause too much stress or frustration.
- The pattern’s rules are objective and easy to follow.


