
How to catch better entries with the Head and Shoulders Pattern? In this series of articles learn the different ways you can trade the head and shoulders chart pattern. The first part of this article deals with setting more realistic target levels on the head and shoulders pattern.
Among chart watchers and technical analysts, the head and shoulders pattern ranks among one of the top chart patterns that indicates a reversal (or rare cases a continuation) to the previous trend.
Any trader who has done a bit of studying of chart patterns would have no doubt been drawn to the allure of the head and shoulders pattern. The importance of this pattern is further accentuated by the fact that many analysts in the financial media often refer to this pattern.
The reliability of the head and shoulders pattern (which is bearish) and the bullish inverse head and shoulders pattern is further validated by Tom Bulkowski of the famed thepatternsite.com. It is not surprising therefore to note that the Head and Shoulders top is ranked 1 out of 21, meaning ‘the best.’ Bulkowski further goes on giving more stats such as a 4% break even failure rate and a 55% probability of price meeting its target.
You can read Bulkowski’s deeper analysis on the head and shoulders pattern (along with tons of other patterns).
Anatomy of the Head and Shoulders Pattern
The Head and Shoulders pattern is very easy to spot and can be a caution for traders especially when the pattern occurs at the top end of a rally or its bearish counterpart, the inverse head and shoulders that occurs at the trough of a downtrend.
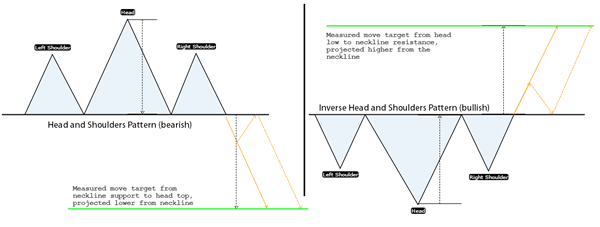
H&S and Inverse H&S Pattern Basic Structure
In the chart above, you can see the basic structure and the set up of the head and shoulders pattern (bullish and bearish). The neckline support (or resistance) is the key as a breakout from this level indicates a shift in the trend.
The most basic way to trade the head and shoulders pattern is to wait for the breakout from the neckline. Some traders prefer to wait for a retest back to the neckline while others simply buy or sell on the breakout. The target is set to a measured move, measured from the head (high or low) to the neckline (support or resistance) and projected from there on.
Drawback of the Head and Shoulders pattern
The head and shoulders pattern is more ideally suited to trade stocks or assets where volume is reliable. Typically, low volume during the formation of the right shoulder is used as one of the markers and prepares traders for the impending breakout. Volume in forex is not as reliable compared to stocks due to the OTC nature. Even if volume were to be used somehow, there is no guarantee that price will reach the target (despite more than 50% probability according to stats).
So how can a trader effectively position themselves to better make use of this reversal pattern? The following ideas can help traders.
Using a 161.8% Fibonacci Extension as the first target
Instead of a full projection in the head and shoulders, using a 161.8% Fibonacci extension as the first target, measured from the head (high or low) to the neckline (support or resistance) can beneficial for traders. The chance of price reaching the 161.8% target is much higher than the full measured move (which is basically a 200% extension). So after the first target is reached, your trade has already taken the reward off the table while leaving the remainder of the position to trade risk-free at the very least.
Example:
In the chart below you can see the relative ease at which the 161.8% Fib extension level of the head and shoulders pattern was reached. In comparison, you can notice that the full measured move of the head and shoulders pattern, prices consolidated briefly and reversed back higher.
If you account for spreads and other factors, there is a very good chance of price falling short of the full measured move target and instead of reversing.
You can also gauge that by setting the price target to 161.8% Fib extension, the initial probability of 55% can be further improved.
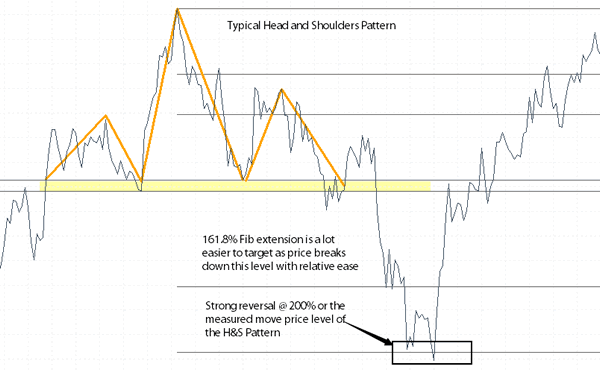
Head and Shoulders Example (161.8% and 200% Fib extension levels)
In the next article, we take a look at how to anticipate the head and shoulders pattern in advance before the pattern is formed.


