
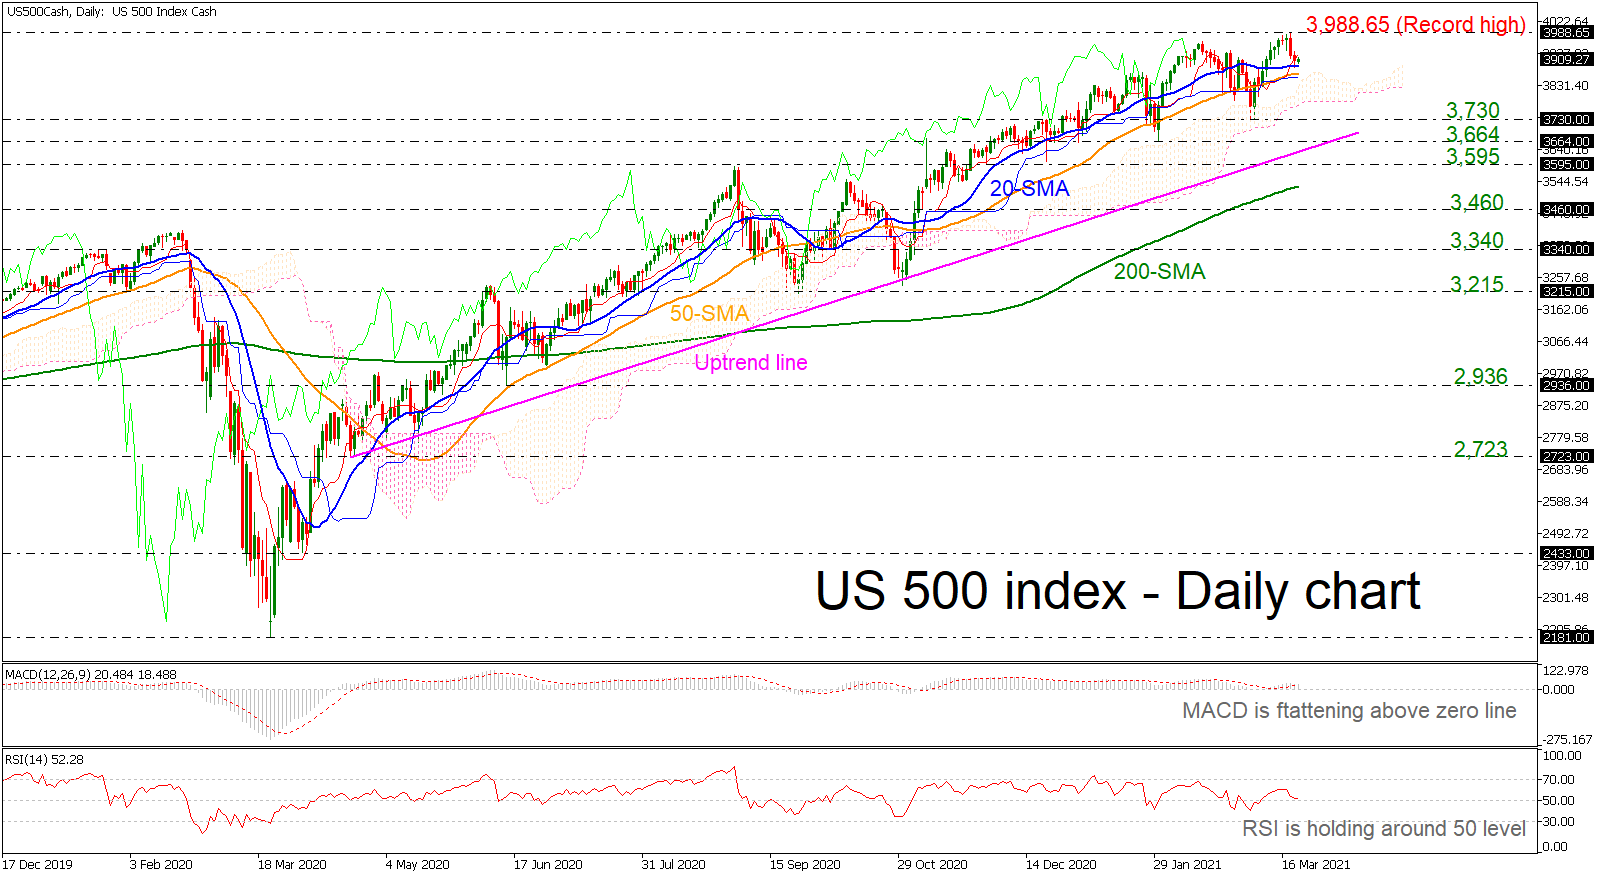
The US 500 index is slipping from the all-time high of 3,988.65 and is retesting the 20-day simple moving average (SMA) after two consecutive red days.
The technical indicators are suggesting a horizontal movement. The MACD is holding below the trigger line in the positive region, while the RSI is approaching the 50 level with weak momentum. In trend indicators, the Ichimoku cloud is holding below the current market price and the red Tenkan-sen line capped the index.
If there is a bounce off the SMAs, the index could flirt again with the record high, slightly below 4,000. A rise above this crucial line would take the market to uncharted levels such as 4,100, 4,500.
On the flip side, a fall underneath the Ichimoku cloud and the short-term SMAs could hit the 3,730 support and the long-term ascending trend line around 3,664. A penetration of the diagonal line could change the outlook to neutral, meeting 3,595 and the 200-day SMA currently at 3,529.
In conclusion, the broader outlook is bullish without any significant downside corrections.


