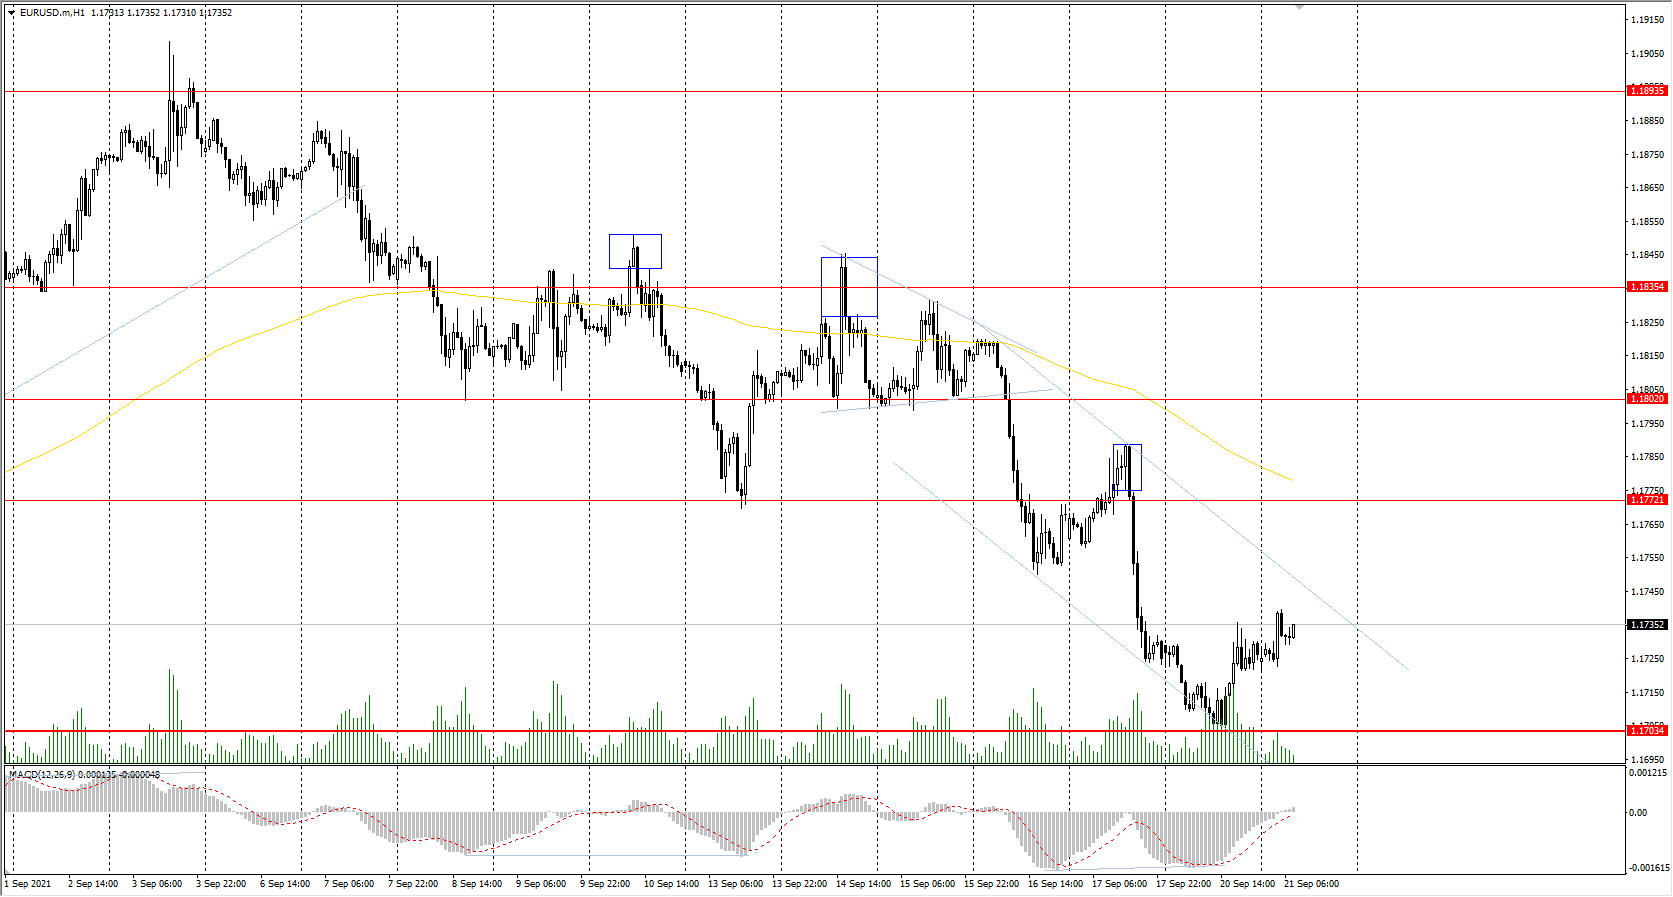
The EUR/USD currency pair
Technical indicators of the currency pair:
Prev Open: 1.1729
Prev Close: 1.1725
% chg. over the last day: -0.03%
Despite the growth of the German producer price index by 12%, the German Dax index decreased by 2.3% yesterday amid general concerns over the Evergrande problems. Europe’s banking sector and automaker stocks collapsed. Energy problems in Europe aggravate the situation, which is likely to strengthen inflation dynamics in the near future.
Trading recommendations
Support levels: 1.1704, 1.1620
Resistance levels: 1.1772, 1.1802, 1.1835, 1.1894, 1.1934, 1.1969
From the technical point of view, the general trend of the EUR/USD currency pair is bullish. Yesterday, the price reached the priority change level but couldn’t break through it. The MACD indicator is in the negative zone, but there are also signs of overselling and reversal. Under such market conditions, the buy deals from the priority change level can be considered. This is where the buyers show initiative. It is best to look for sell trades throughout the day, from the resistance zone near the moving average.
Alternative scenario: if the price breaks down through the 1.1704 support level and fixes below, the mid-term uptrend will likely be broken.
News feed for 2021.09.21:
- US Building Permits (m/m) at 15:30 (GMT+3).
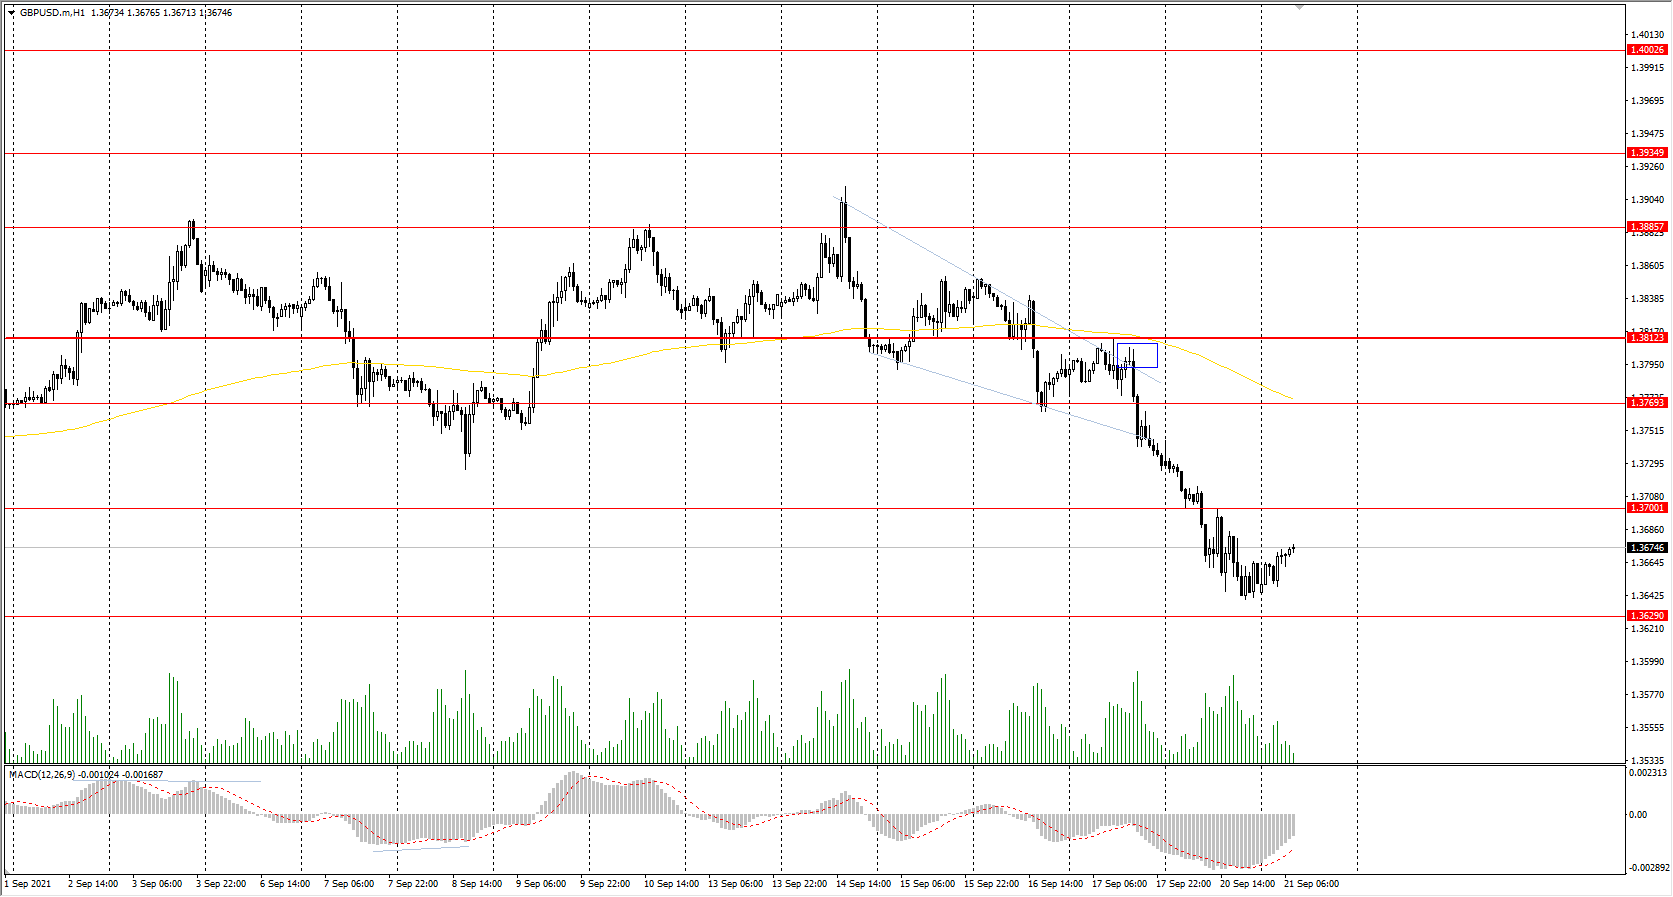
The GBP/USD currency pair
Technical indicators of the currency pair:
Prev Open: 1.3731
Prev Close: 1.3651
% chg. over the last day: -0.58%
There is an increase in the three-month dollar LIBOR rate in the interbank market in London. It indicates the demand for the US currency. The British pound has been losing its positions against the US dollar for the last 5 trading sessions. The UK is getting ready to distribute a booster vaccine to people over 50.
Trading recommendations
Support levels: 1.3629, 1.3614, 1.3525
Resistance levels: 1.3701, 1.3769, 1.3812, 1.3886, 1.3935, 1.4002
On the hourly time frame, the GBP/USD trend changed to bearish. GBP/USD currency pair is under sellers’ pressure now. The MACD indicator is in the negative zone, but there are signs that the sell-off is slowing down. Under such market conditions, it is better to look for sell deals from resistance levels near the moving average. Buy trades should be considered only throughout the day and only with short targets from the support levels of higher time frames.
Alternative scenario: if the price breaks out through the 1.3812 resistance level and consolidates above, the bullish scenario will likely resume.
The USD/JPY currency pair
Technical indicators of the currency pair:
Prev Open: 109.91
Prev Close: 109.38
% chg. over the last day: -0.48%
While anticipation of a new government has already raised Tokyo stocks to their highest level for 31 years, many analysts believe that the victory of the Minister of Vaccination and reform advocate Taro Kono in the September 29 election will push stock prices even higher. The Japanese yen is also strengthening ahead of the upcoming election of the prime minister.
Trading recommendations
Support levels: 109.43, 109.18, 108.65
Resistance levels: 109.82, 110.09, 110.40, 110.66, 110.95
The main trend of the USD/JPY currency pair is bearish. But amid the strengthening of the Japanese yen, the USD/JPY moved downward again. The MACD indicator is in the negative zone, but there are weak signs of buying. Under such market conditions, traders should look for sell positions from the resistance level near the moving average. Only intraday buy positions from the support levels should be considered, where there is an initiative of buyers.
Alternative scenario: if the price rises above 110.09, the uptrend is likely to resume.

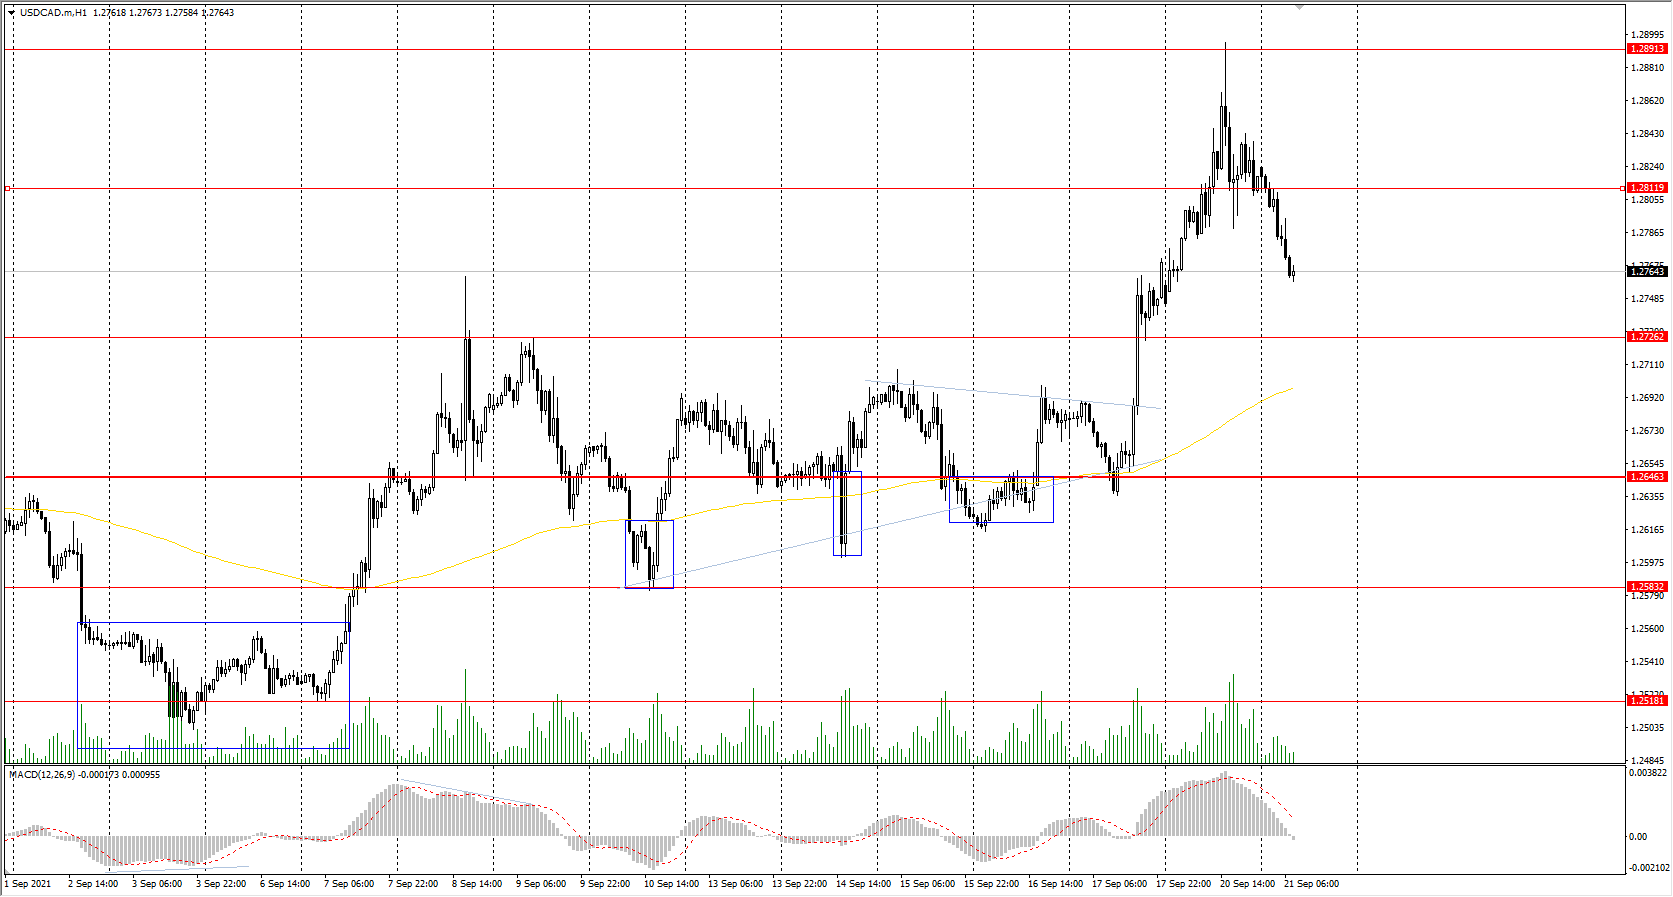
The USD/CAD currency pair
Technical indicators of the currency pair:
Prev Open: 1.2756
Prev Close: 1.2819
% chg. over the last day: +0.49%
The Canadian dollar is a commodity currency, so the USD/CAD currency pair is highly dependent on the dynamics of the dollar index and oil prices. The dollar index is slowly rising, while oil prices are trading flat. As a result, the price of USD/CAD keeps moving up. Options analysis shows that the Canadian dollar has turned into one of the worst derivatives for hedge funds.
Trading recommendations
Support levels: 1.2726, 1.2646, 1.2583, 1.2518, 1.2425
Resistance levels: 1.2812, 1.2891, 1.2951
From the technical point of view, the situation is uncertain. On the one hand, the price broke through the priority change level yesterday, but on the other hand, the price quickly returned back below the level. The MACD indicator became inactive. Under such market conditions, it is better to trade within the local trend, which is obviously bullish. It is best to look for buy trades from the support levels near the moving average. There are no optimal entry points for sell positions now.
Alternative scenario: if the price breaks down through the 1.2646 support level and fixes below, the uptrend will likely be broken.