
The USDCHF pair fell for three straight sessions, trading around 0.8960 during Monday’s Asian session. The daily chart shows a bearish trend, with the pair staying below the 9- and 14-day Exponential Moving Averages (EMAs). The 14-day Relative Strength Index (RSI) is below 50, signaling continued weakness. If the pair drops further, it could find support at 0.8900, with a break below that possibly leading to the two-month low of 0.8736. On the upside, resistance levels are at 0.9009 and 0.9026, based on the 9- and 14-day EMAs. A break above these could boost momentum toward the recent high of 0.9201.
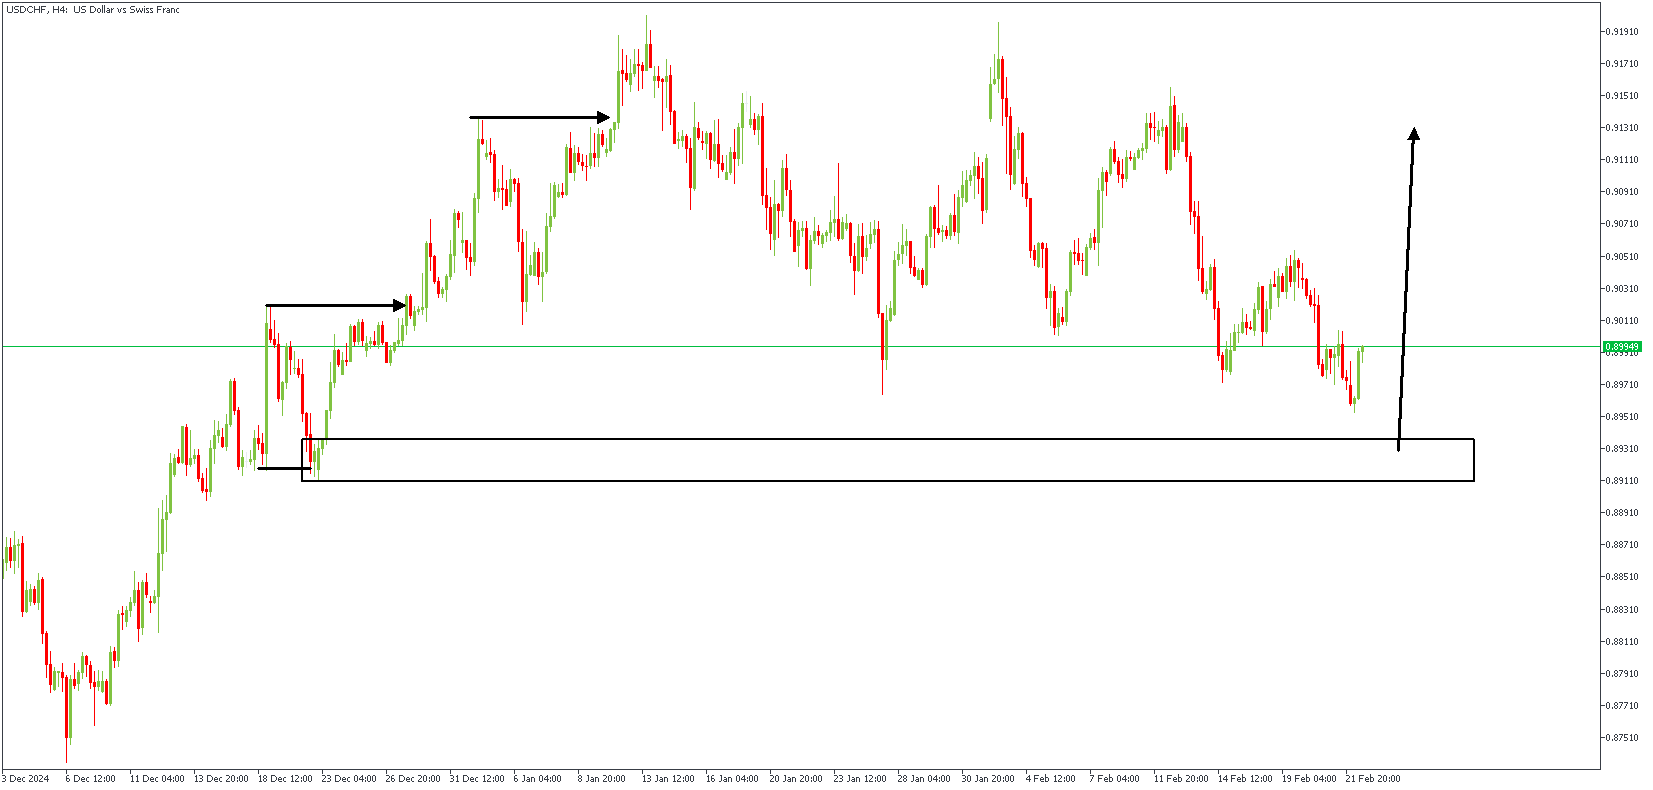
USDCHF – H4 Timeframe
When the price sweeps above/below a previous turning point (high or low) before breaking the structure in the opposite direction, the new high/low created becomes a “protected” point. Regarding the price action on the 4-hour timeframe chart of USDCHF, we see that the price is currently approaching a “protected” low after having printed a double break of the structure pattern. The expected outcome here is bullish.
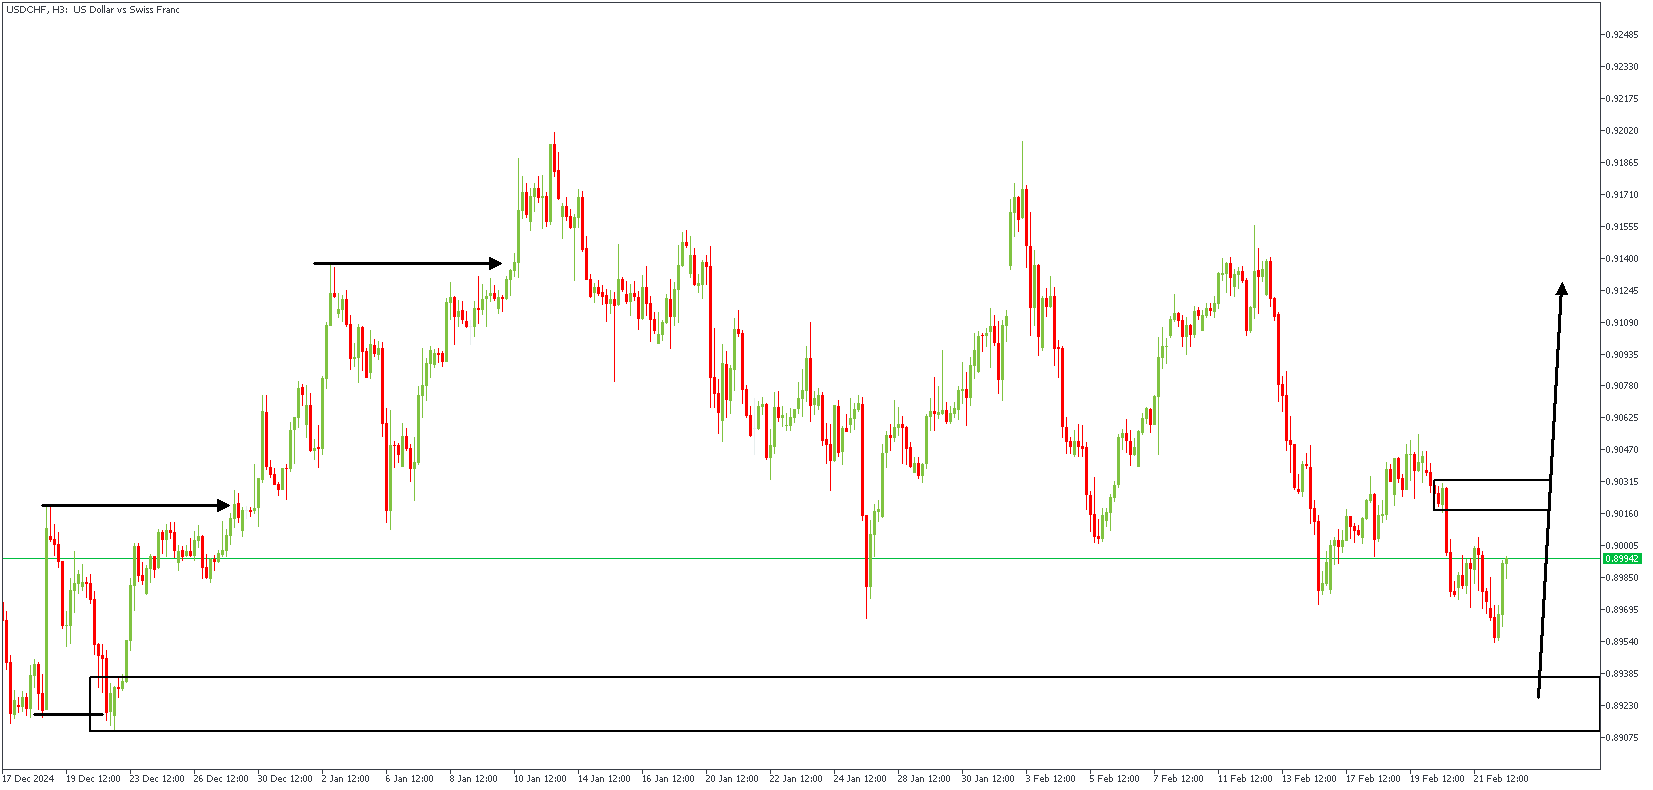
USDCHF – H3 Timeframe
On the 3-hour timeframe chart of USDCHF, the price still has an unfilled FVG (fair value gap) area, meaning it could be seeking an avenue to return to the FVG before embarking on the bullish continuation.
Analyst’s Expectations:
- Direction: Bullish
- Target- 0.91199
- Invalidation- 0.88900


 before breaking the structure in the opposite direction, the new high/low created becomes a “protected” point. Regarding the price action on the 4-hour timeframe chart of USDCHF, we see that the price is currently approaching a “protected” low after having printed a double break of the structure pattern. The expected outcome here is bullish.)