
Silver has had quite a run this month, up 7.40% only since the 10th of July.
Today we’ll take a quick look at an update of a multi-timeframe Silver analysis to spot the ongoing trends and see if the trend has still some juice.
This article is a continuation of the article posted on the 15th of July where we only looked at intraday timeframes.
Now let’s take a step back.
Silver Weekly Chart
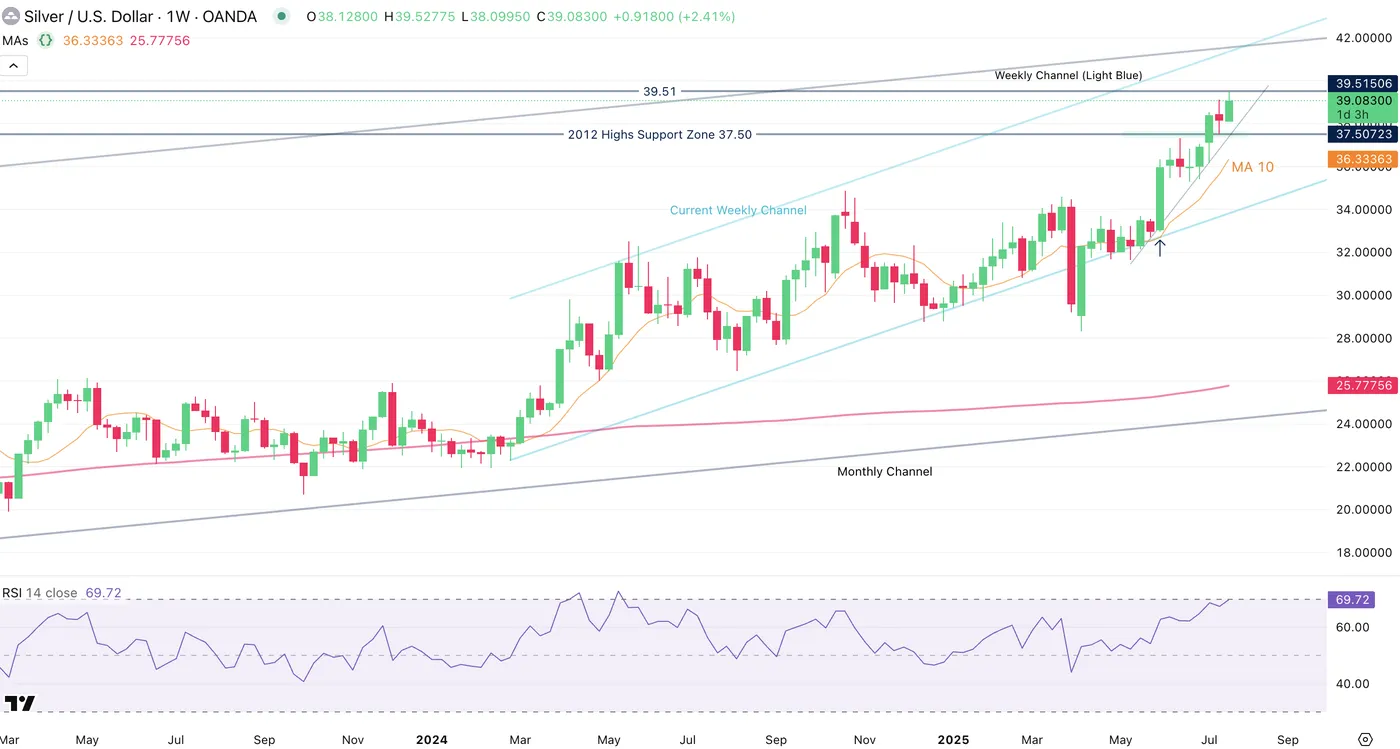
Silver Weekly Chart, July 24 2025 – Source: TradingView
Momentum is strong for the metal but starting to test the upper bound of the RSI with around $2 to $3 missing towards the highs of the ongoing light blue weekly channel.
This is a good drawing to keep on your charts to maintain a good view of where we are in the current trend.
Silver Daily Chart
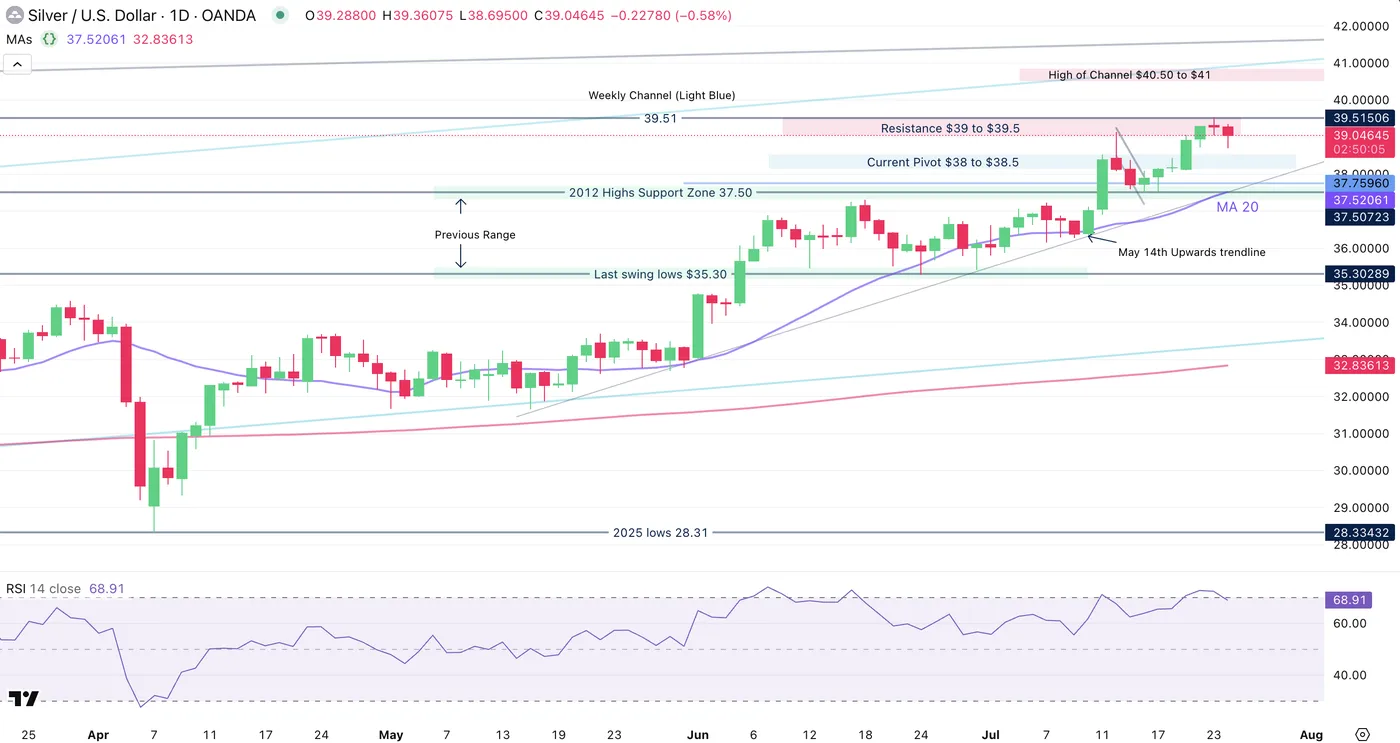
Silver Daily Chart, July 24 2025 – Source: TradingView
The precious metal has made an impulsive move higher reaching the $39 to $39.50 Resistance we observed last week.
There is still work to do to test the high of the weekly channel, but the overbought conditions in the metal will make it difficult for an immediate move to happen.
The 20 Day Moving Average is slowly catching up to the current prices, currently at $37.50.
The two last impulsive moves (black arrows on the chart) have happened at around 20 days after the 20-Day MA rejoined the growing prices, after momentum retracted back to neutral.
The higher probabilities are pointing towards a consolidation/small retracements to the trendline rather than an immediate break higher. Of course, anything can happen.
Silver 4H Chart
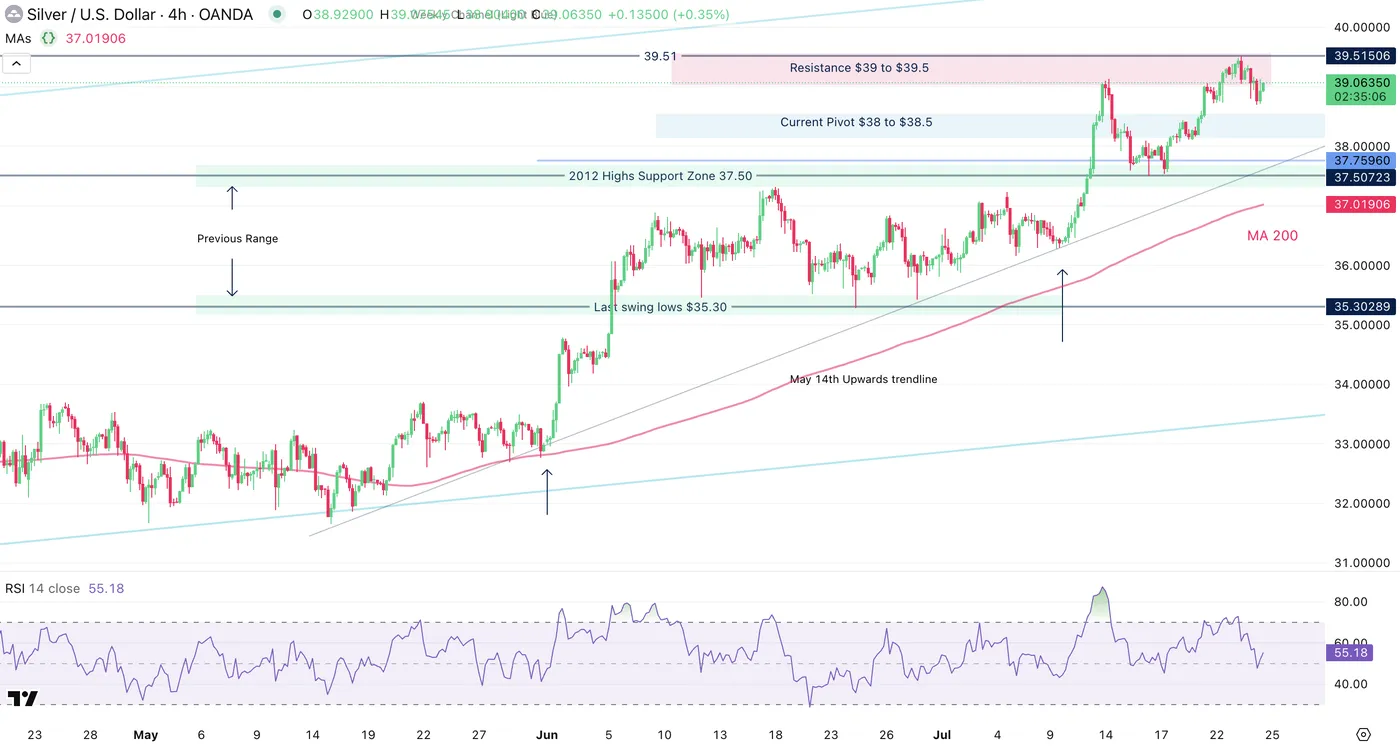
Silver Daily Chart, July 24 2025 – Source: TradingView
Looking at the immediate price action, there are still some probabilities of an upside breakout, however a strong move higher on good volume with a daily close above the 39.51 previous highs would be necessary to up these odds (a simple retest won’t do it for now).
If a retracement lower happens, the consolidation has a high chance to hold between 37.50 (2012 Support) and 39.50 (Current resistance), particularly as these levels coincide with the May upwards trendline.
If buyers maintain the prices above $39 throughout the end of the week, the odds of an upside breakout increase strongly
Support Levels:
- Immediate intraday support 146.37 and 30m MA 50
- 146.00 Pivot Zone (+/- 100 pips)
- Overnight lows 145.85
- Main Daily Support 142.00 region
Resistance Levels:
- Resistance $39 to $39.5
- 39.51 last swing highs
- $40.50 to $41 potential Resistance at ATH and top of Rising Channel
A look back to the 2011 Silver chart
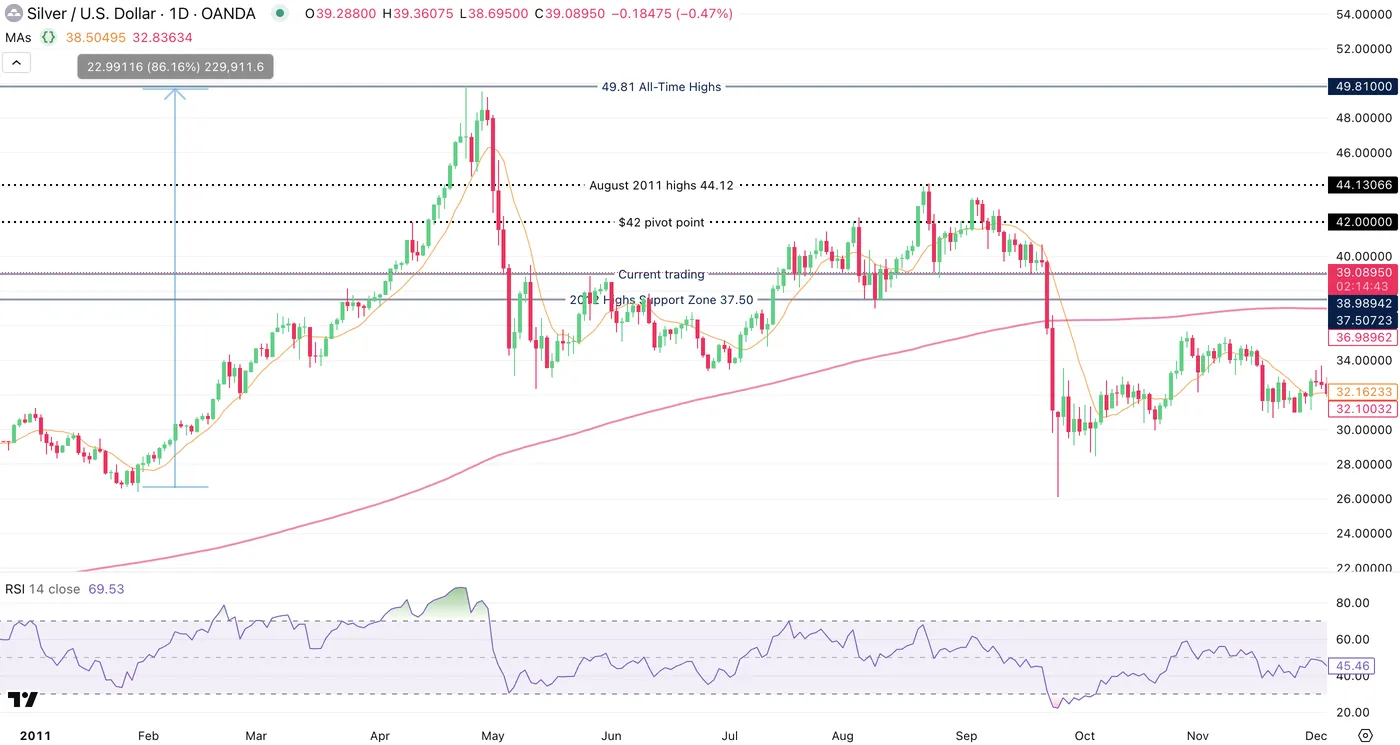
Silver 2011 Daily Chart (all-year) – Source: TradingView
It’s interesting to look back at past performances especially when assets or financial products come back to previous historic levels.
Spot the levels of major reactions on this chart, this could be interesting to watch if Silver reaches similar prices
Most commonly traded Metals performance since May 2025
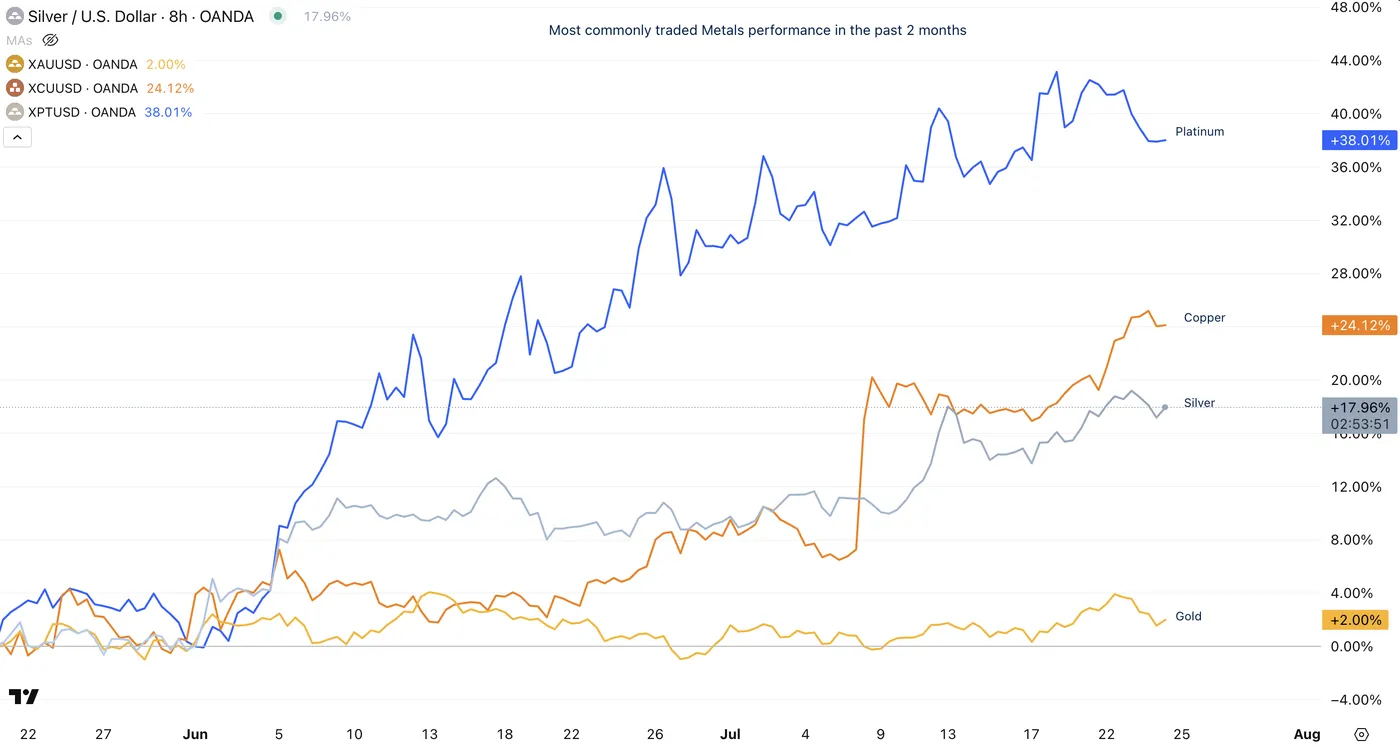
Metals comparative performance since the past 2 months, July 2025 – Source: TradingView
Metals are ongoing a mighty move higher, similar to what happened between 2008 and 2011.
Higher deficits seem not to have an end, and except for surprising rate hikes (unexpected for now), there doesn’t seem to be many reasons for metals to retrace essentially
(except for a sudden cancelling of tariffs, substantially low odds of this happening.)
Safe Trades!


