
Key Highlights
- GBP/USD gained bearish momentum below the 1.3500 support.
- It traded below a bullish trend line with support at 1.3450 on the 4-hour chart.
- EUR/USD tumbled below the 1.1660 and 1.1620 support levels.
- The US Gross Domestic Product could grow by 2.4% in Q2 2025 (Preliminary).
GBP/USD Technical Analysis
The British Pound turned red below 1.3500 against the US Dollar. GBP/USD gained bearish momentum and traded below the 1.3420 support zone.
Looking at the 4-hour chart, the pair traded below a bullish trend line with support at 1.3450. It even settled below the 1.3400 level, the 100 simple moving average (red, 4-hour), and the 200 simple moving average (green, 4-hour).
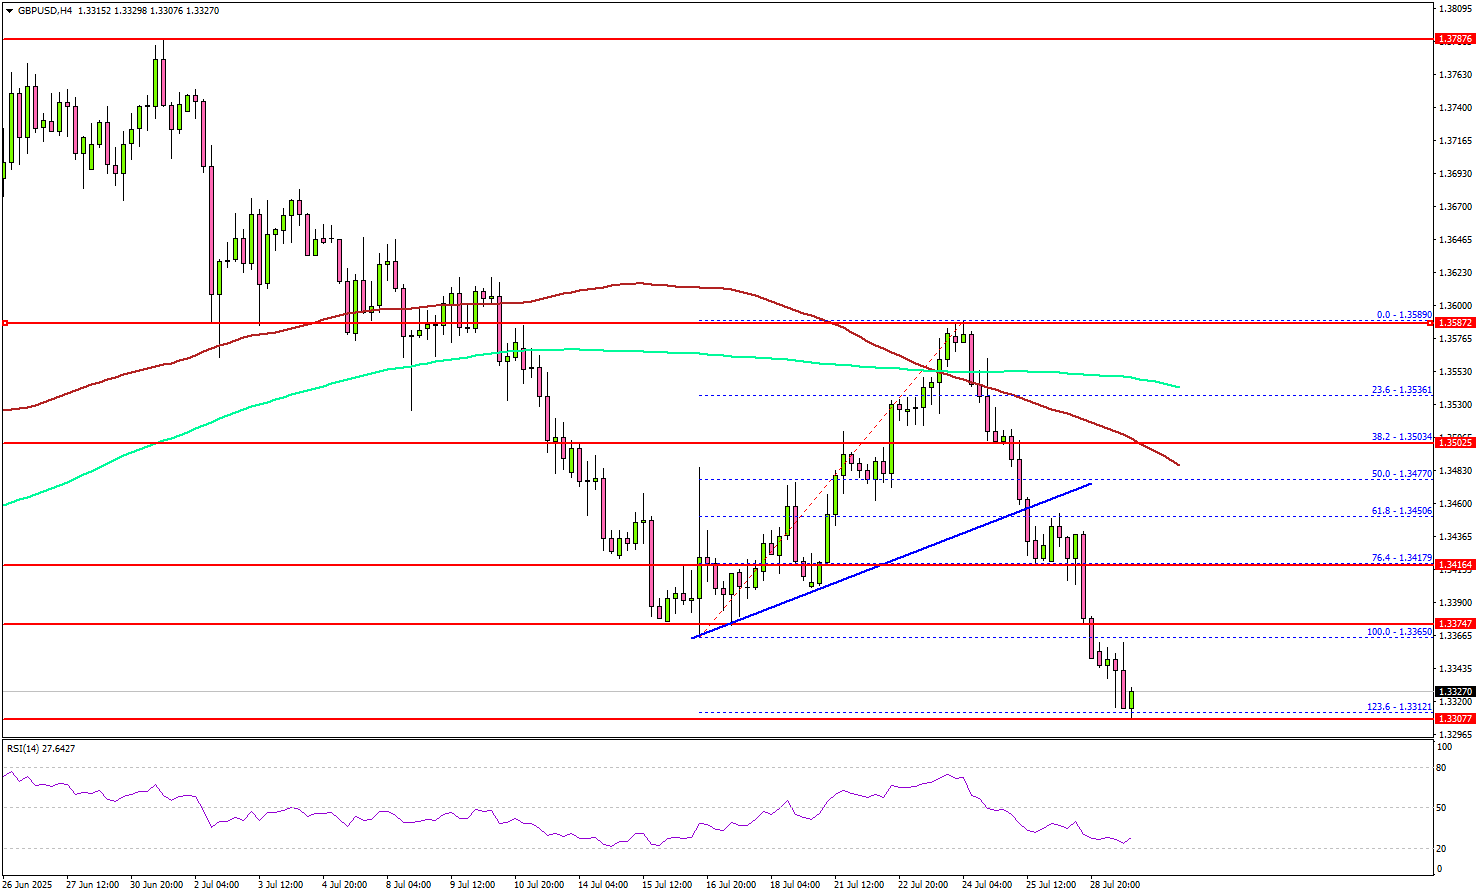
The decline was such that the pair tested the 1.236 Fib extension level of the upward move from the 1.3365 swing low to the 1.3589 high. On the downside, immediate support is near the 1.3310 level.
The next key support sits near 1.3280. Any more losses could send the pair toward the 1.3220 support zone. On the upside, the pair now faces resistance near the 1.3375 level. The next key resistance sits near the 1.3420 level.
A close above the 1.3420 level could set the pace for another increase. In the stated case, the pair could rise toward the 1.3500 resistance. The next major stop for the bulls could be near the 1.3550 resistance.
Looking at GBP/USD, the pair is showing bearish signs and might decline below the 1.1500 support zone.
Upcoming Economic Events:
- US Gross Domestic Product for Q2 2025 (Preliminary) – Forecast 2.4% versus previous -0.5%.
- Fed Interest Rate Decision – Forecast 4.5%, versus 4.5% previous.


