
Gold price climbed again and traded above $3,350. Crude oil is showing bearish signs and might decline below $62.80.
Important Takeaways for Gold and WTI Crude Oil Price Analysis Today
- Gold price started a steady increase from $3,310 against the US Dollar.
- A key bullish trend line is forming with support at $3,378 on the hourly chart of gold at FXOpen.
- Crude oil prices failed to clear the $65.00 region and started a fresh decline.
- There was a break below a major bullish trend line with support at $64.00 on the hourly chart of XTI/USD at FXOpen.
Gold Price Technical Analysis
On the hourly chart of Gold at FXOpen, the price found support near $3,310. The price remained in a bullish zone and started a strong increase above $3,330.
There was a decent move above the 50-hour simple moving average and $3,350. The bulls pushed the price above the $3,365 and $3,378 resistance levels. Finally, the price climbed as high as $3,395 before there was a pullback.
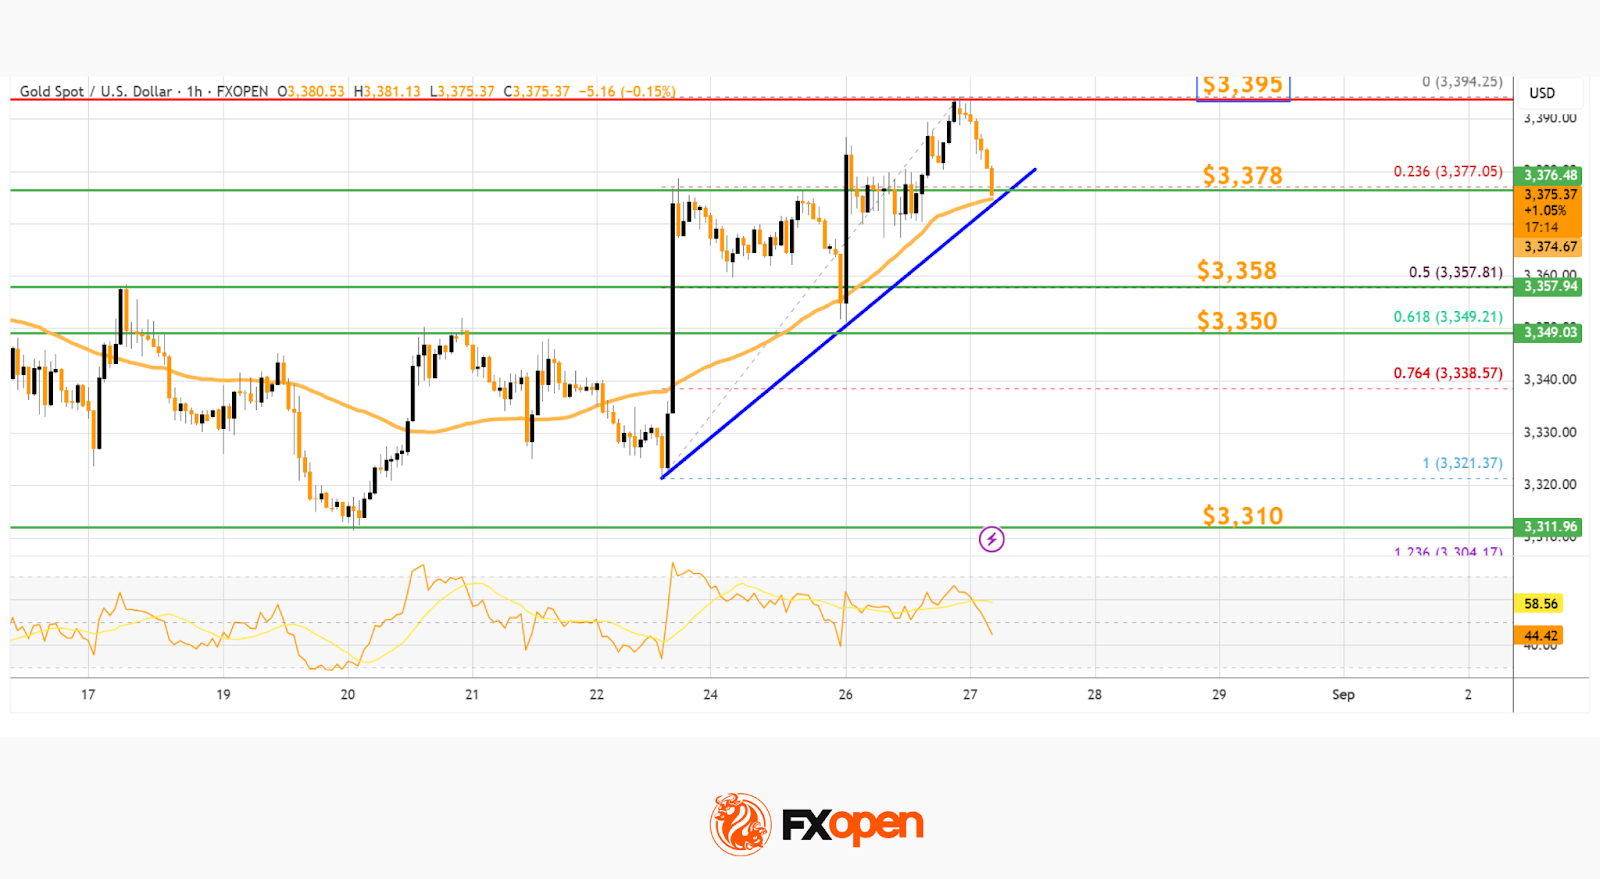
The price tested the 23.6% Fib retracement level of the upward move from the $3,321 swing low to the $3,395 high, and the RSI declined below 50. Initial support on the downside is near $3,378 and the 50-hour simple moving average.
The first major support is near the 50% Fib retracement at $3,358. If there is a downside break below $3,358, the price might decline further. In the stated case, the price might drop toward $3,350. Any more losses might push the price toward $3,310.
Immediate resistance is near the $3,395 level. The next major hurdle for the bulls is $3,400. An upside break above $3,400 could send Gold price toward $3,420. Any more gains may perhaps set the pace for an increase toward $3,450.
WTI Crude Oil Price Technical Analysis
On the hourly chart of WTI Crude Oil at FXOpen, the price struggled to clear the $65.00 level and started a fresh decline below $64.50.
There was a break below a major bullish trend line at $64.00, opening the doors for more losses. The price dipped below the 50% Fib retracement level of the upward move from the $61.56 swing low to the $64.85 high.
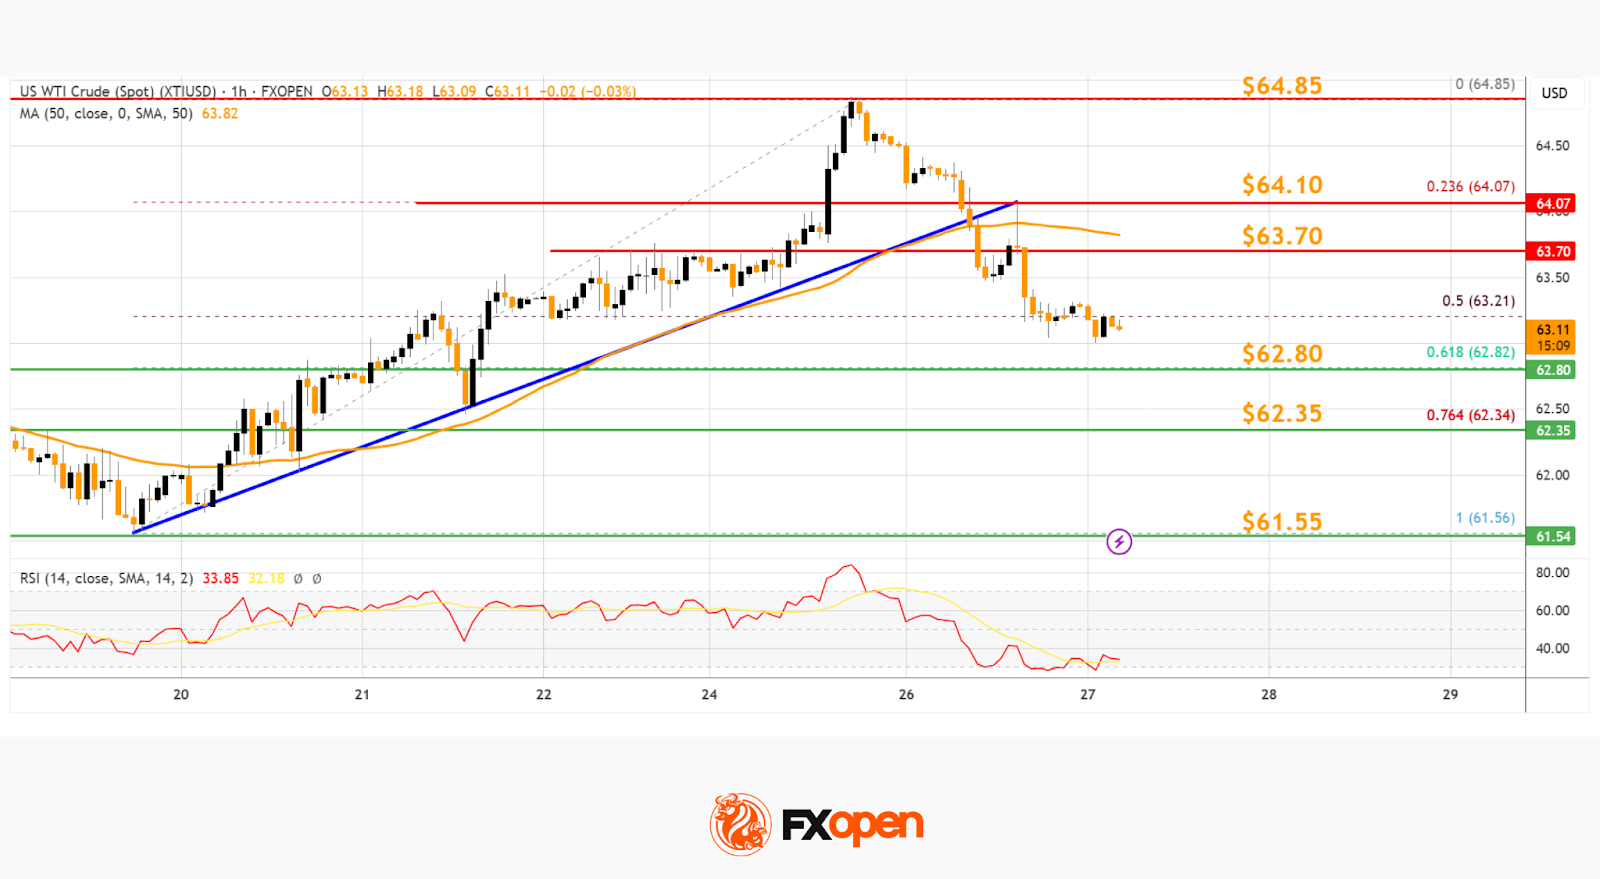
XTI/USD even dipped below $63.50 level and the 50-hour simple moving average. The bulls are now active near $63.00. If there is a fresh increase, it could face a barrier near $63.70.
The first major resistance is near $64.10. Any more gains might send the price toward $64.85 and call for a test of $65.50. Conversely, the price might continue to move down and revisit the $62.80 support and the 61.8% Fib retracement.
The next major support on the WTI crude oil chart is $62.35. If there is a downside break, the price might decline toward $61.55. Any more losses may perhaps open the doors for a move toward $60.50.


