
GDP data for Q2 just got released – A 3.3% annualized beat vs a 3.1 expectations could have been expected to lead to a USD rally, but the reverse happened instead.
The Greenback is currently the second worst performer of all majors, just ahead of the CHF.
Tomorrow will also await the GDP data release for Canada which should add to some volatility in the pair.
USDCAD is now back into its July range which spanned between 1.3550 to 1.38 – Further correction would be needed to fully confirm the re-entry – Discover which ones in our technical analysis just below.
In terms of tariffs, the “duty-free shipping” de minimis exemption of Canadian goods to the US expires on Friday which is creating fears of higher costs for Canadians and Americans.
Tariff talks were in a bit of a limbo but with the deadline approaching, Canada PM Mark Carney decided to drop many retaliatory tariffs against the US in an attempt to reduce the uncertainty towards animous relations between the two neighbors.
USDCAD multi-timeframe technical analysis
USDCAD Daily Chart
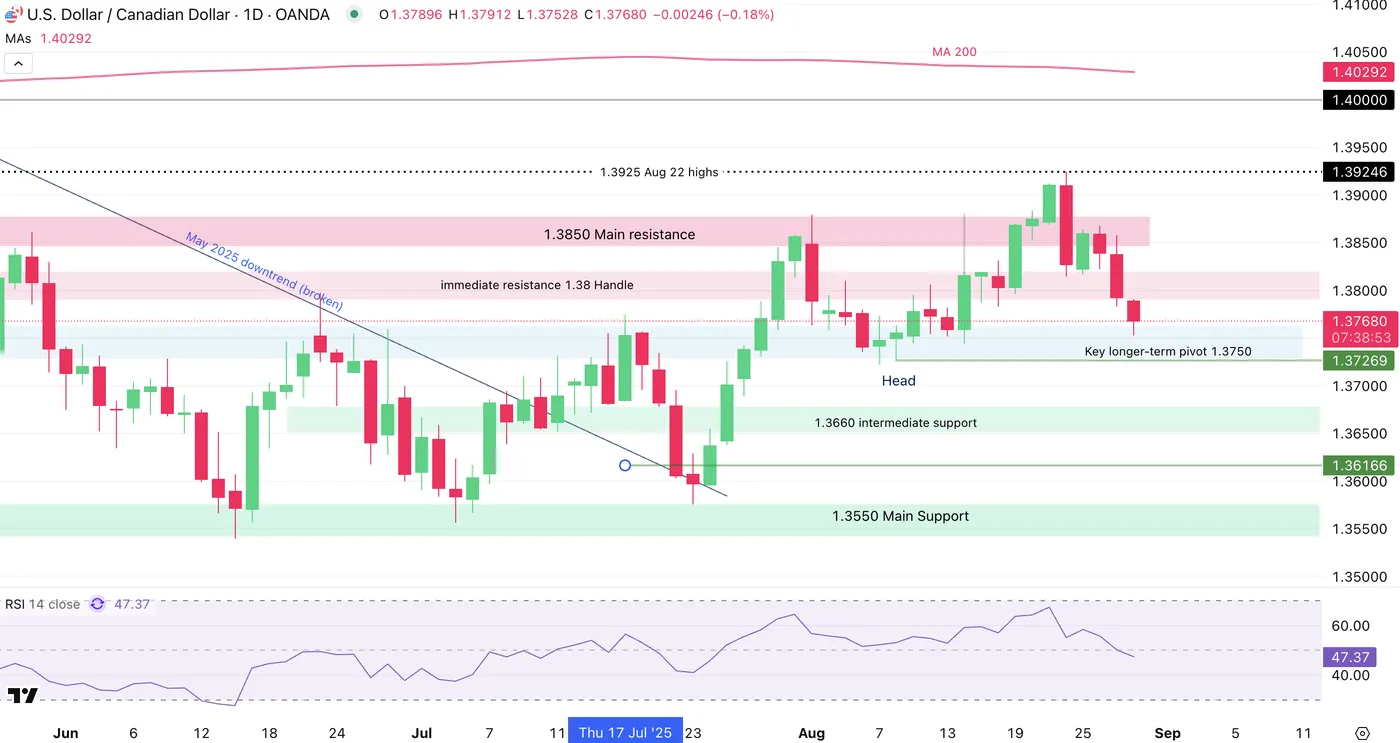
USDCAD Daily Chart, August 28, 2025 – Source: TradingView
The pair had been holding just above the 1.38 handle (1.38130) for a few moments but ironically, right after the release of our mid-week NA Markets recap mentioning the support level, US Dollar selling flows broke support.
In the meantime, the today’s selling is entering the 1.3750 Pivot Zone (+/- 150 pips) and some small mean-reversion is happening right ahead of the 50-Day MA (1.3735).
Daily momentum is also breaching the neutral RSI level towards the bearish side, adding to the odds of a full range re-entry of the pair, after prolonged CAD weakness.
We will see if tomorrow’s Canada GDP data corroborates with the current technicals.
USDCAD 4H Chart
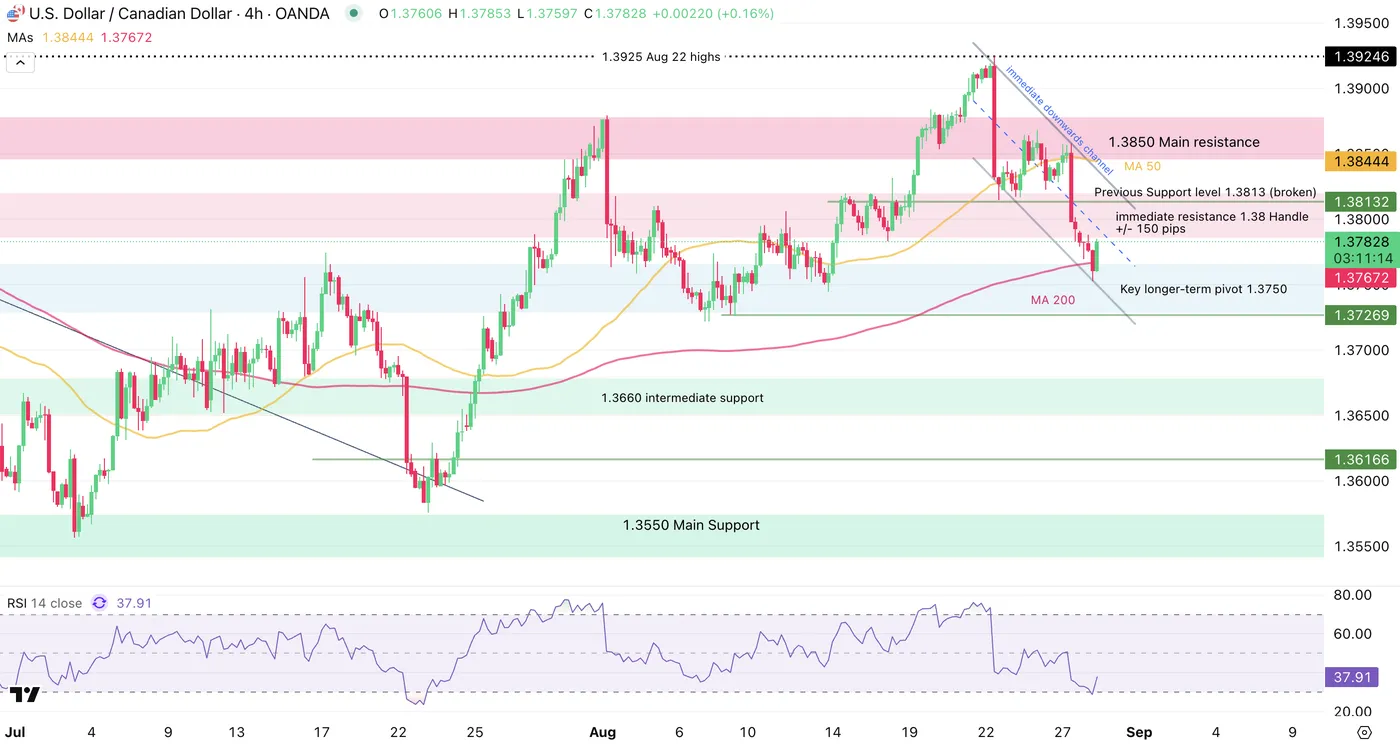
USDCAD 4H Chart, August 28, 2025 – Source: TradingView
After previously holding around the 1.38130 level held buy USDCAD bulls, their
Buyers are stepping in after strong selling flows at the pivot zone, therefore the 1.38 resistance zone should come into play soon.
The resistance zone may also act in confluence with the middle of the current downward channel – bearish reactions here will be key to re-enter the range. Failure to do so should lead to a retest of the 1.3850 Main resistance zone.
Levels to place on your USDCAD charts:
Resistance Levels:
- 1.38 immediate resistance Zone (+/- 150 pips)
- 1.3850 Main resistance
- 1.3925 Aug 22 highs last Friday highs
- May Highs 1.40185
Support Levels:
- 4H MA 200 and 50-Day MA between 1.3730 and 1.3760
- Key longer-term pivot Zone 1.3750
- Main Support Zone 1.3675 to 1.3686
USDCAD 1H Chart
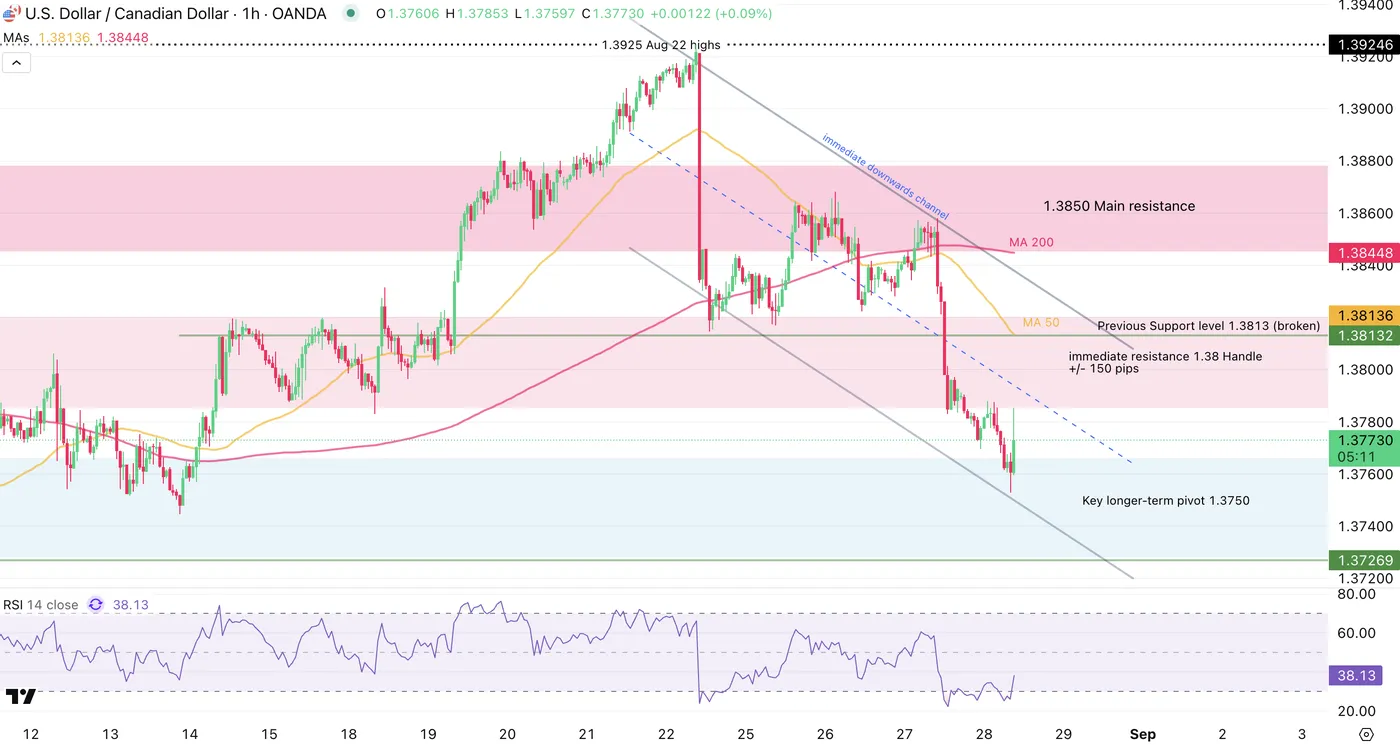
USDCAD 1H Chart, August 28, 2025 – Source: TradingView
The immediate action is fairly balanced, with the 1H RSI rebounding from oversold – However, the current 1H candle is seeing immediate rejection as markets are approaching the low of the immediate resistance zone.
A continuation of the downmove should take the pair towards the lows of the pivot zone between 1.37 to 1.3725.
Price action may consolidate a bit before further movement due to low RSI levels – Keep those in check.
For immediate breakout levels, look at the High of current 1H Candle 1.3785 for continued upside, while for a breakdown, look at the Daily lows at 1.3753.
Safe Trades!


