
Today’s energy story centered on Europe’s gradual but firm shift from Russian oil.
Recent headlines have circled back to the fact that some EU nations were still discreetly buying Russian barrels, prompting Trump’s blunt remark at the UN — that they are “funding the war against themselves.”
Since the 2022 invasion of Ukraine, Europe’s reliance on Russian energy has declined considerably, but hasn’t been reduced to zero as promised.
The Trump administration has been moving to sanction Russian oil buyers more aggressively, tightening the screws on Moscow’s revenues to pressure their capacity to pursue the conflict.
As a matter of fact, Trump recently mentioned Hungary that Hungary will “soon stop buying Russian oil” in that same United Nations speech.
WTI prices have reflected the shift in the market, with two consecutive sessions of 1% up-moves suggesting traders are preparing for higher prices sourced from elsewhere as the supply of “cheap Russian oil” continues to shrink, at least for western nations.
About the Ukraine conflict itself, momentum seems to have tilted further toward Kyiv.
President Zelenskiy said US support under Trump could even sway China’s role in the conflict, while Trump himself doubled down, stating that with the EU’s backing, “Ukraine is in a position to fight, win, and take all of Ukraine back.”
In the meantime, let’s examine a few key charts for US Oil (WTI) to see where prices could be heading in the current situation.
US Oil Daily Chart
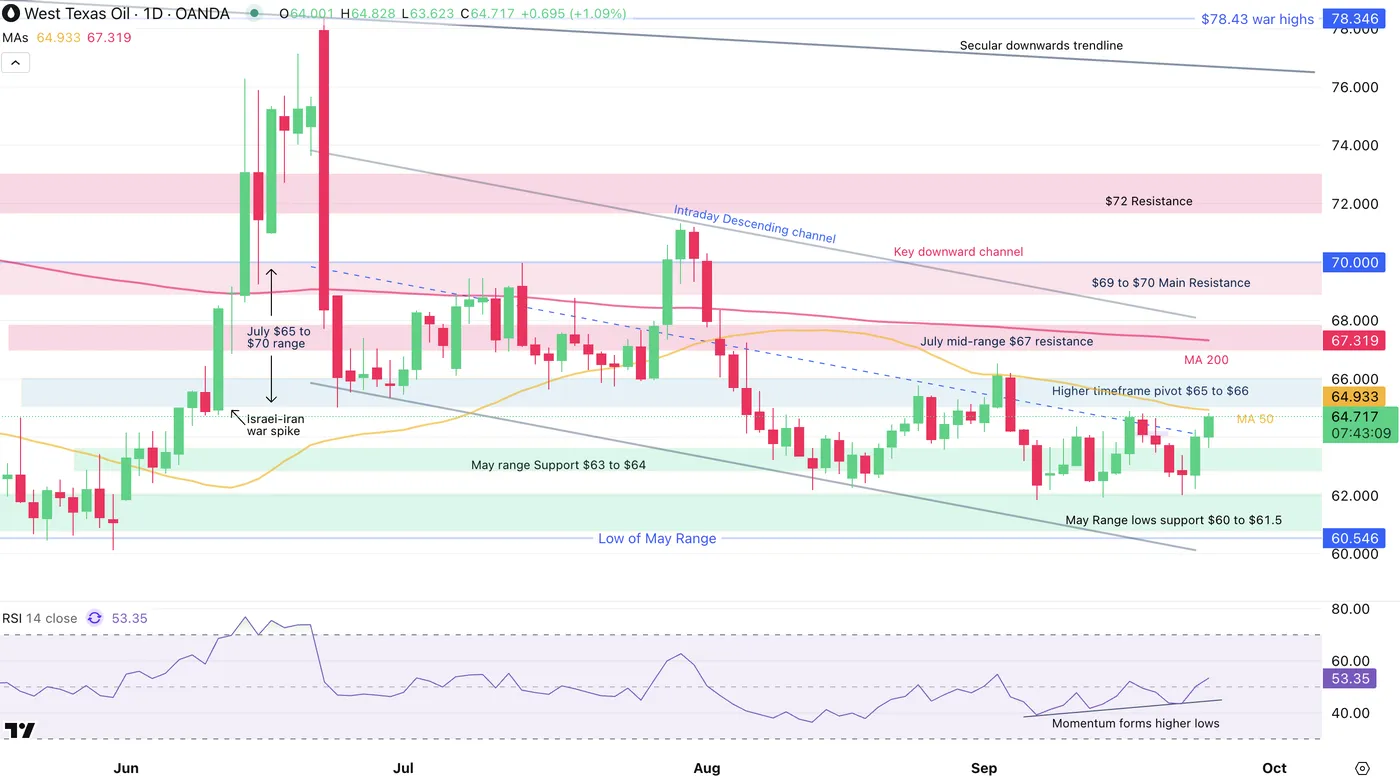
US Oil Daily Chart, September 24, 2026 – Source: TradingView
As can be seen on the daily picture, Oil prices have gradually recessed since the mid-June Middle East war spikes.
Since, a July range, followed by gradual step-by-step price corrections have taken Oil back into just above its May range.
Momentum is still increasing, forming higher lows and bulls will have to push above the 50-Day Moving Average.
Having failed to close above this key technical indicator since the 4th of August (despite many breakout attempts), any break higher followed by a session close should see further continuation. Let’s take a closer look
WTI Oil 4H Chart
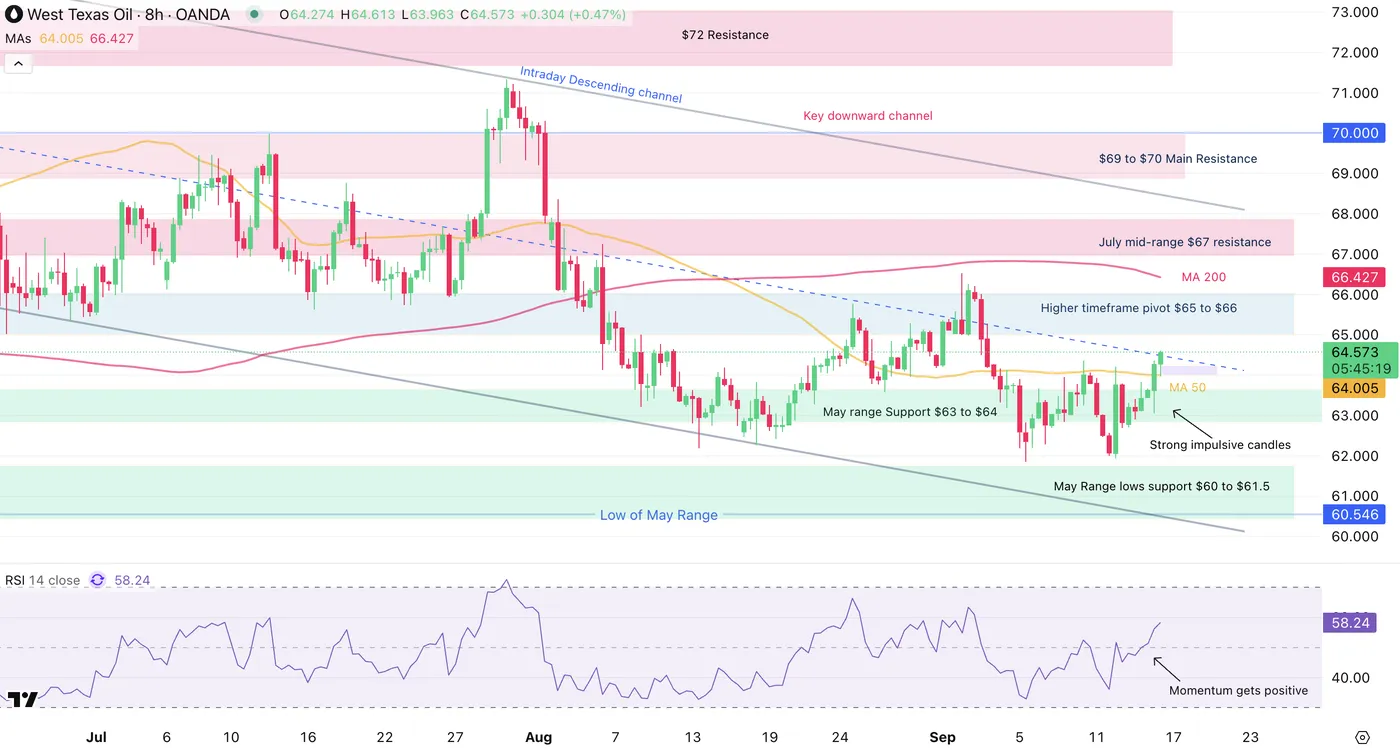
US Oil 4H Chart, September 24, 2026 – Source: TradingView
Moving averages could provide further information on the current move and explain why the preceding breakout attempts mentioned in our previous articles have failed to hold.
Indeed, the fundamentals had stayed the same (Russian war continuing and buyers were still actively buying) – Therefore a close above the pivot point was found with sharp rejection.
The technical element to look for could be the 4H-200 period MA: The freshly closed 4H candle was a strong bull one closing at its highs and it seems that there is ongoing continuation.
To confirm the ongoing breakout, a further continuation above the 50-day MA mentioned just before will be necessary.
If not, expect the current $62 to $65 range to hold.
Levels to place on your WTI charts:
Resistance Levels
- Higher timeframe pivot $65 to $66
- Shorter timeframe Consolidation Highs ($64.35 to $65 testing)
- 50-Day MA $64.93
- July mid-range $67 resistance
Support Levels
- Shorter timeframe Consolidation Lows ($62 to 62.50)
- 4H MA-200 63.80
- Current consolidation lows $61.84 to $62
- $60.5 Low of May Range
US Oil 1H Chart
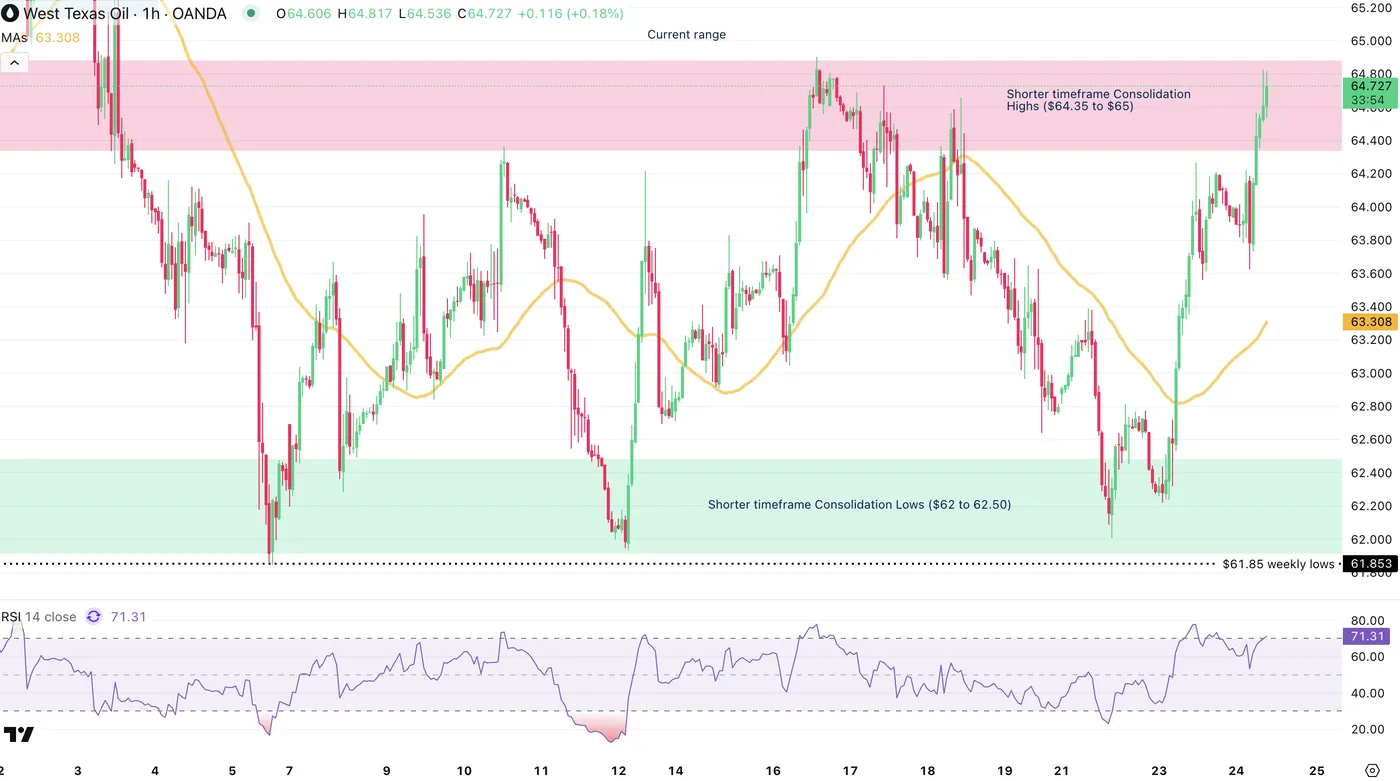
US Oil 1H Chart, September 24, 2026 – Source: TradingView
Looking even closer to the 1H timeframe, momentum seems to get close to overbought but the daily action holding within a tight bull channel, there is still potential for a breakout.
Follow the latest geopolitical news closely (particularly with new tariffs on Europe oil buying) and NATO potentially responding to the freshest menaces from Russia.
Safe Trades!


