
It’s a holiday in many OECD countries for the Remembrance of the Great War (World War I).
As most banks are closed throughout Europe and North America, Swiss banks maintain their regular activity, and traders are not sleeping on the latest trade news.
US President Donald Trump confirmed yesterday that Washington is “working on a deal to get the tariffs a little lower” after Swiss business leaders stepped in to drive talks forward.
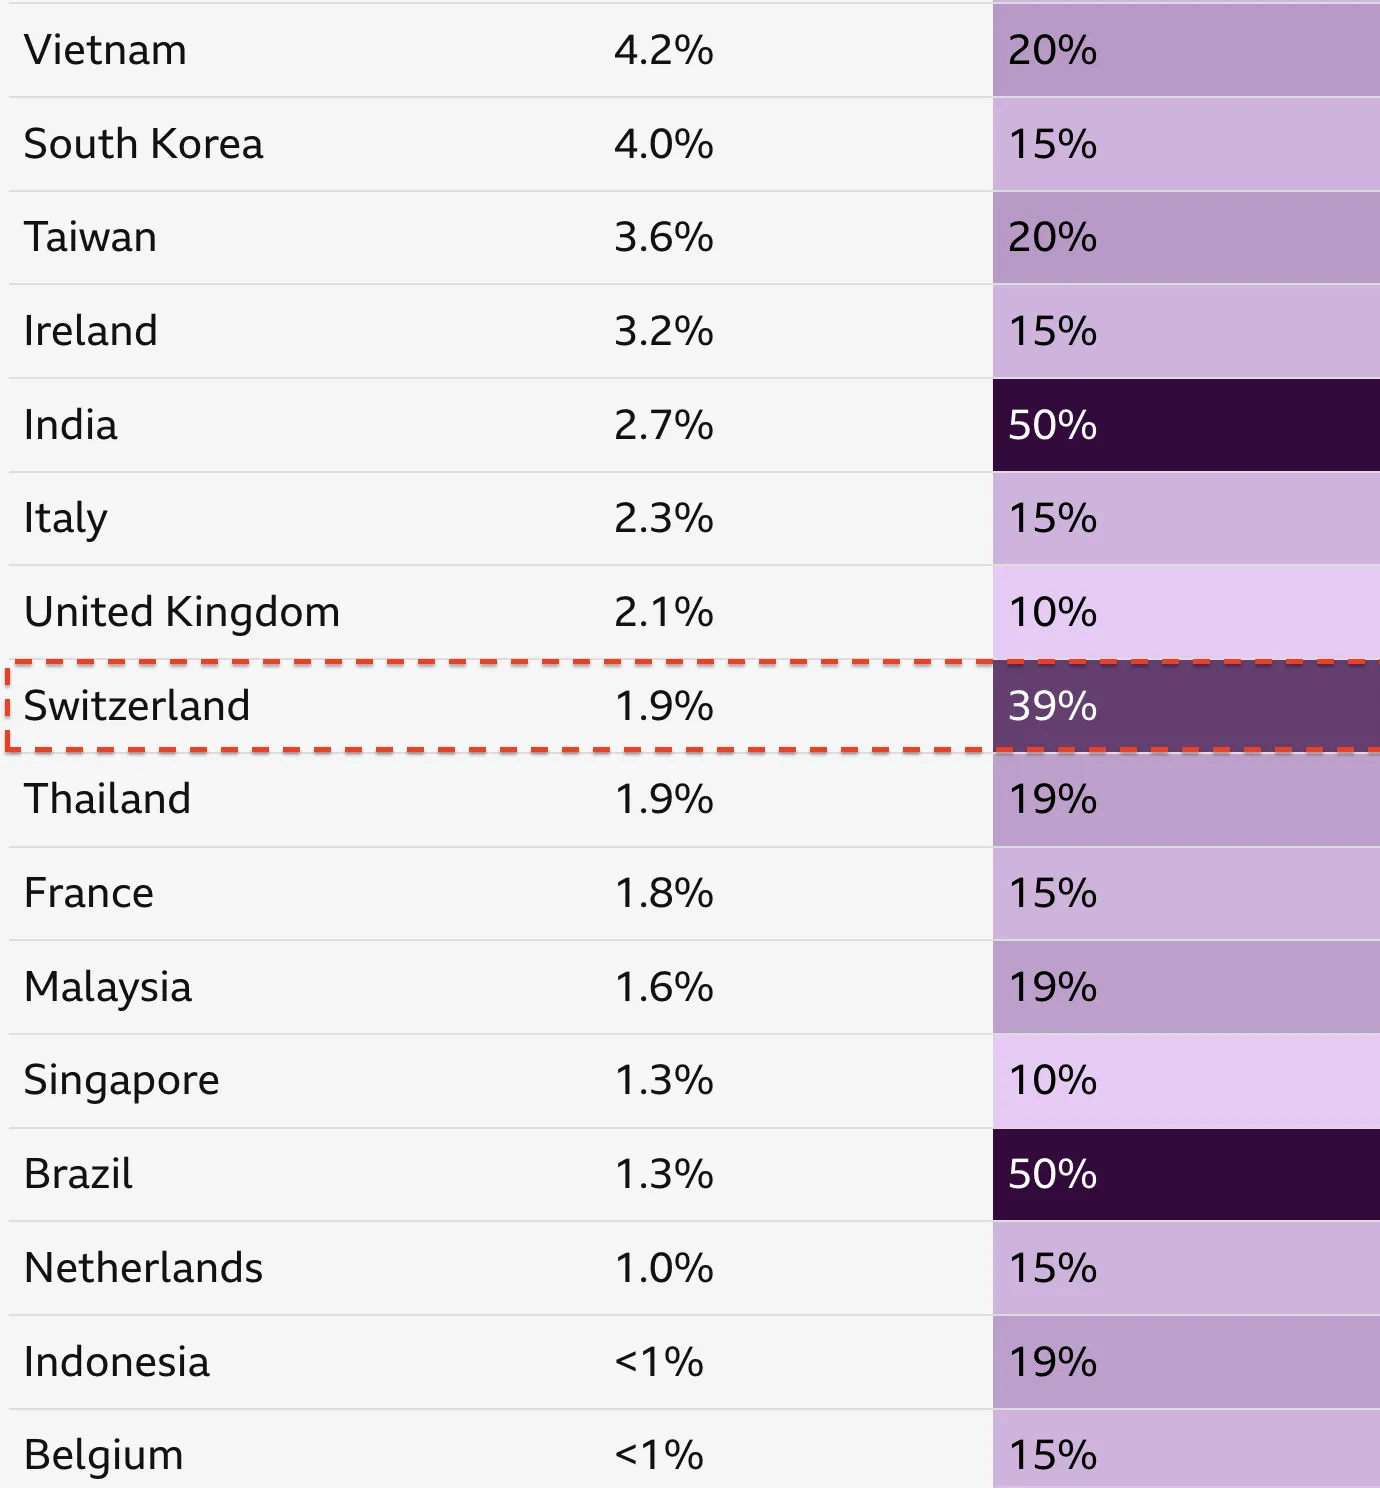
Different tariff rates per economy – Source: BBC
Switzerland is reportedly closing in on securing a much more contained 15% tariff rate—a vast improvement compared to the harsh 39% tariffs imposed in August, which were the highest levies faced by any developed economy.
With the current punitive tariffs already starting to bite into Swiss economic activity, impacting GDP growth in Q3, traders are now pricing in a more stable outlook ahead which put CHF in front of the FX board.
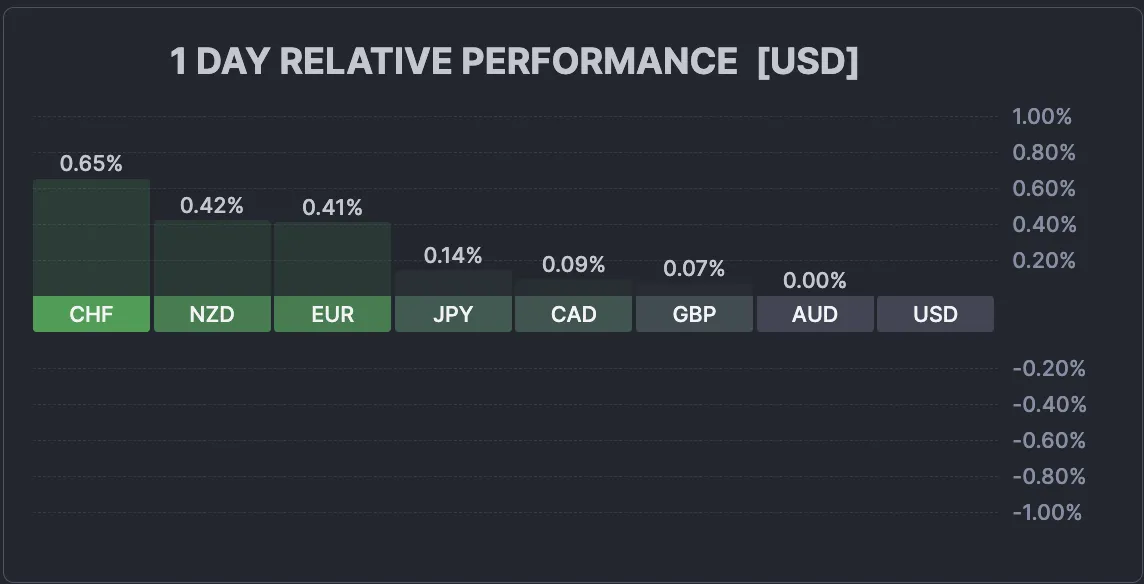
Daily FX performance board – Source: Finviz – November 11, 2025 at 9:47 AM
The rest is to see if the talks, which involved Switzerland’s top trade diplomat Helene Budliger Artieda and Swiss corporate executives, materialize into something concrete within the speculated timeframe of several weeks.
Let’s dive into a multi-timeframe analysis and trading levels for USD/CHF, the most volatile major pair of the session.
USD/CHF Multi-timeframe technical analysis
Daily Chart
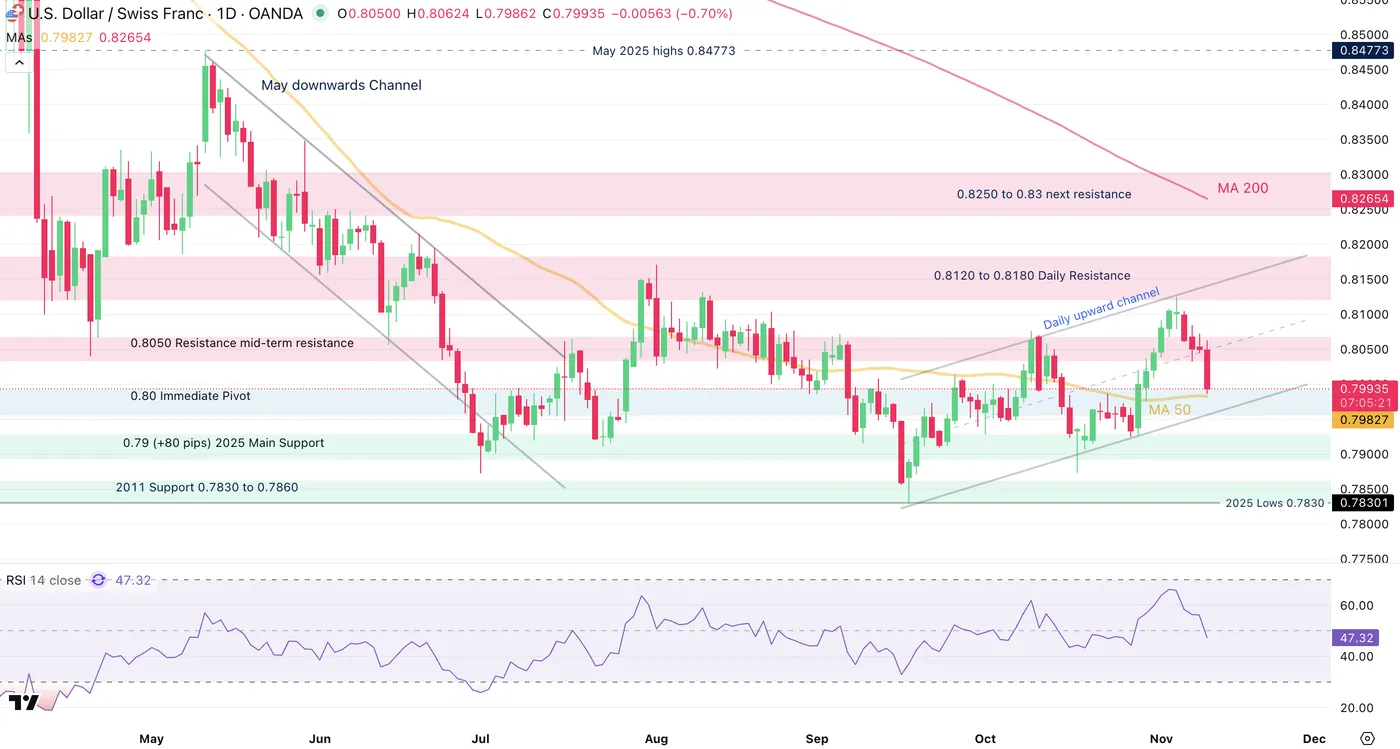
USD/CHF Daily Chart, November 11, 2025 – Source: TradingView
USD/CHF has been moving in up/down yo-yos since the July (1st) bottom in the pair.
Some new yearly lows (0.7830) got reached just ahead of the September FOMC, however no trend has materialized since, which leads to general rangebound conditions in the pair.
The rest will be to see if the appearance of a new deal could generate enough traction to create a new trend in the pair as it reaches the Pivot zone just around the 0.80 level (+/- 100 pips).
RSI Momentum is moving below the neutral level, but looking at the upward channel that appeared from the recent highs, it will be interesting to see how the Market reacts to its lower bound test (around 0.7960).
4H Chart and technical levels
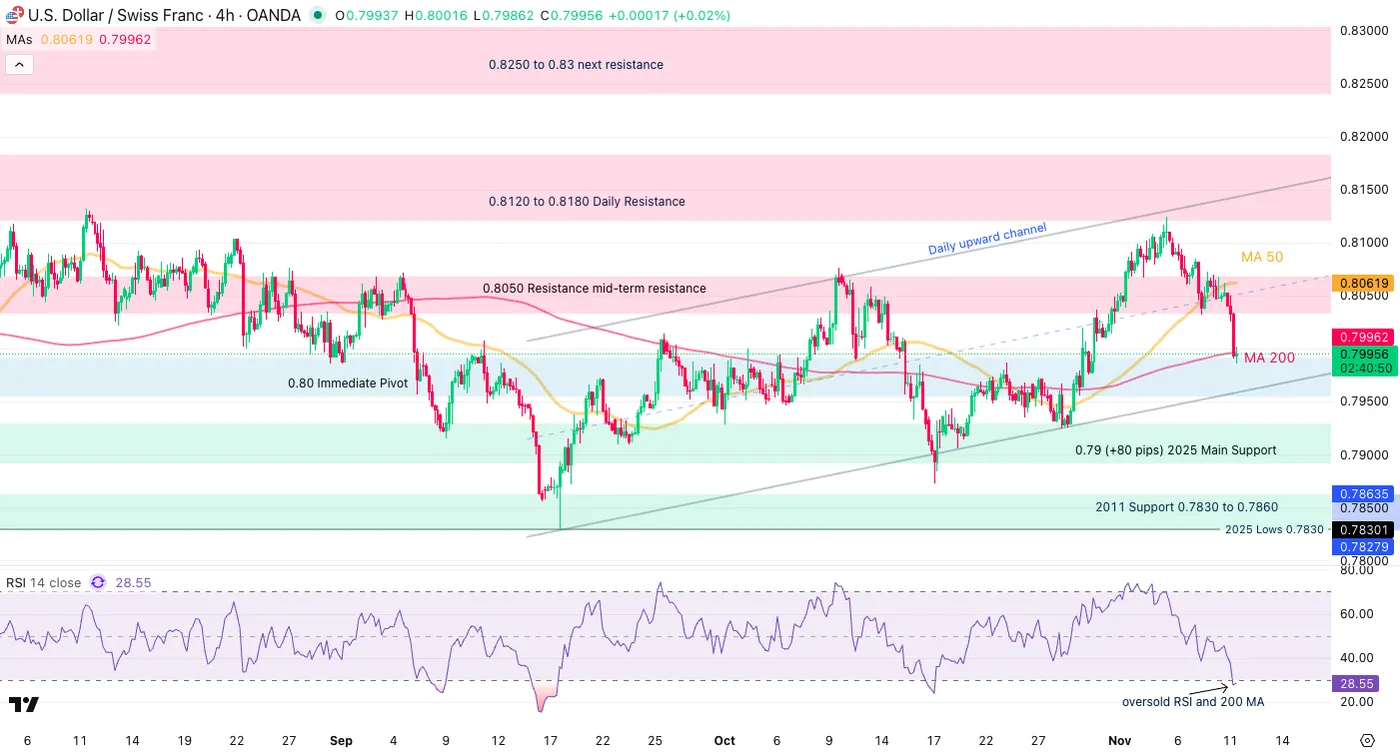
USD/CHF 4H Chart, November 11, 2025 – Source: TradingView
Levels to place on your USD/CHF charts:
Resistance Levels
- Past week highs 0.81244
- 0.8050 Resistance mid-term resistance
- 0.8120 to 0.8180 Daily Resistance
- 0.8250 to 0.83 next resistance
Support Levels
- Pivot zone 0.80 level (+/- 100 pips)
- 0.79 (+80 pips) 2025 Main Support
- 2011 Support 0.7830 to 0.7860
- 2025 Lows 0.7830
1H Chart
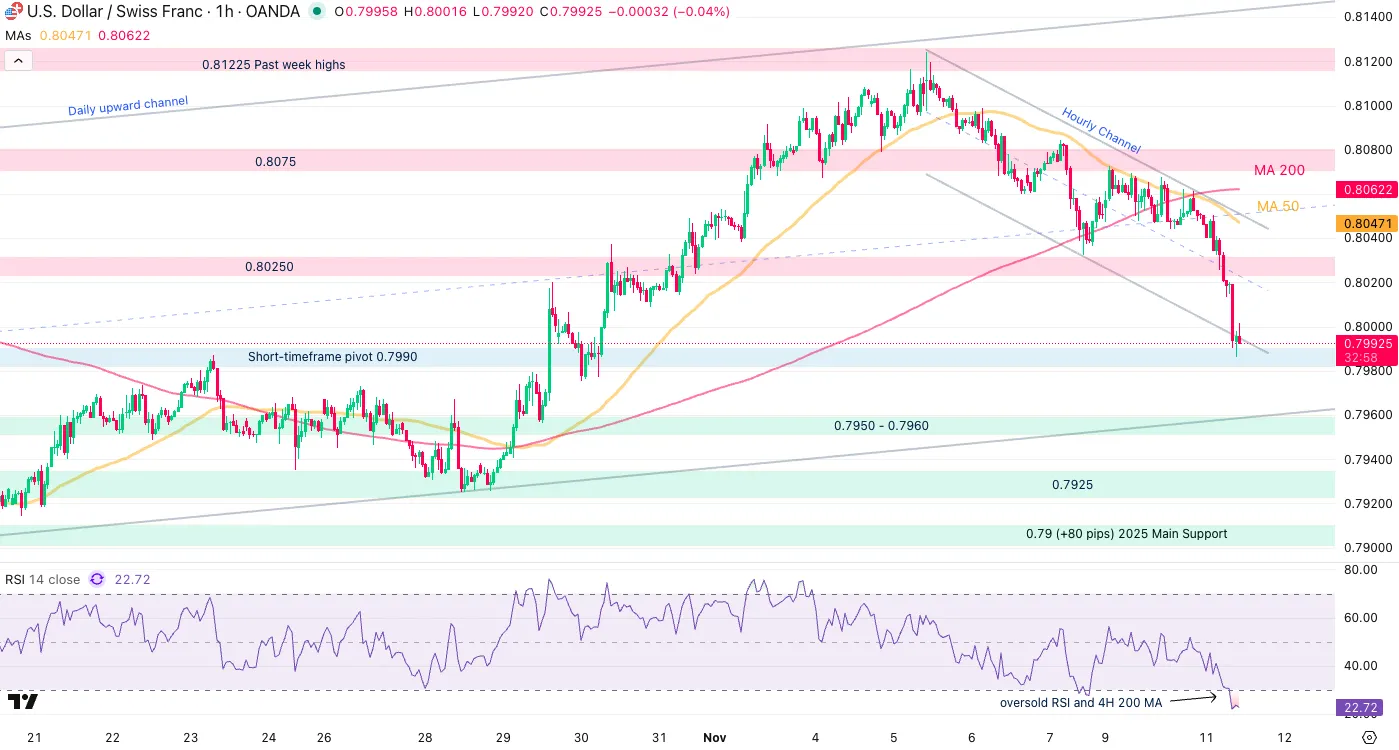
USD/CHF 1H Chart, November 11, 2025 – Source: TradingView
The pair formed a downward channel on shorter timeframes and comes at a key technical point.
The higher timeframe and shorter timeframe pivot zones are converging just below the 0.80 level.
A close below will point to at least a test of the Daily Upward channel lower bound.
A rebound here could retest the zone which sees a confluence of the 50 and 200 Hour MAs.
Safe Trades!


 bottom in the pair. Some new yearly lows (0.7830) got reached just ahead of the September FOMC, however no trend has materialized since, which leads to general rangebound conditions in the pair.)