
As highlighted in our overnight session rewind, Gold has quickly breached above $4,300 and is now racing towards new all-time highs.
The Fed’s cutting cycle and overall 2025 US Exceptionalism from the Trump Administration have had a considerable effect on the demand for non-fiat assets, and Gold is the primary beneficiary of such demand.
The financial world order since the early 2000s has been characterized by high demand for US Treasuries.
As the US maintained higher rates relative to others, even during the Global Financial Crisis, and consequently recovered much more solidly than its OECD peers, it absorbed the flows from the entire globe.
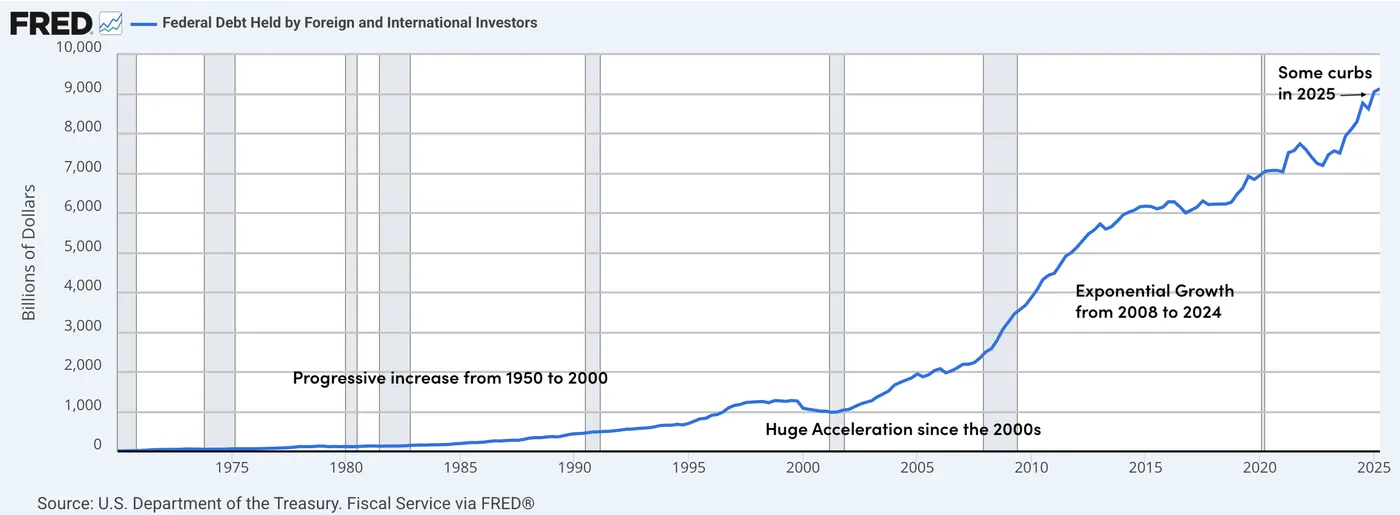
US Debt holdings by Foreign Investors (Central Banks and others) – Source: St. Louis Fed
Metals, on the other hand, were getting replaced by their yielding rivals – Treasuries.
Some Countries, like Canada, have emptied their gold reserves, for example, Making Questionable decisions.
However, as yields had been trending lower, particularly after the QE, demand for metals reformed again, and now, their attraction is without question.
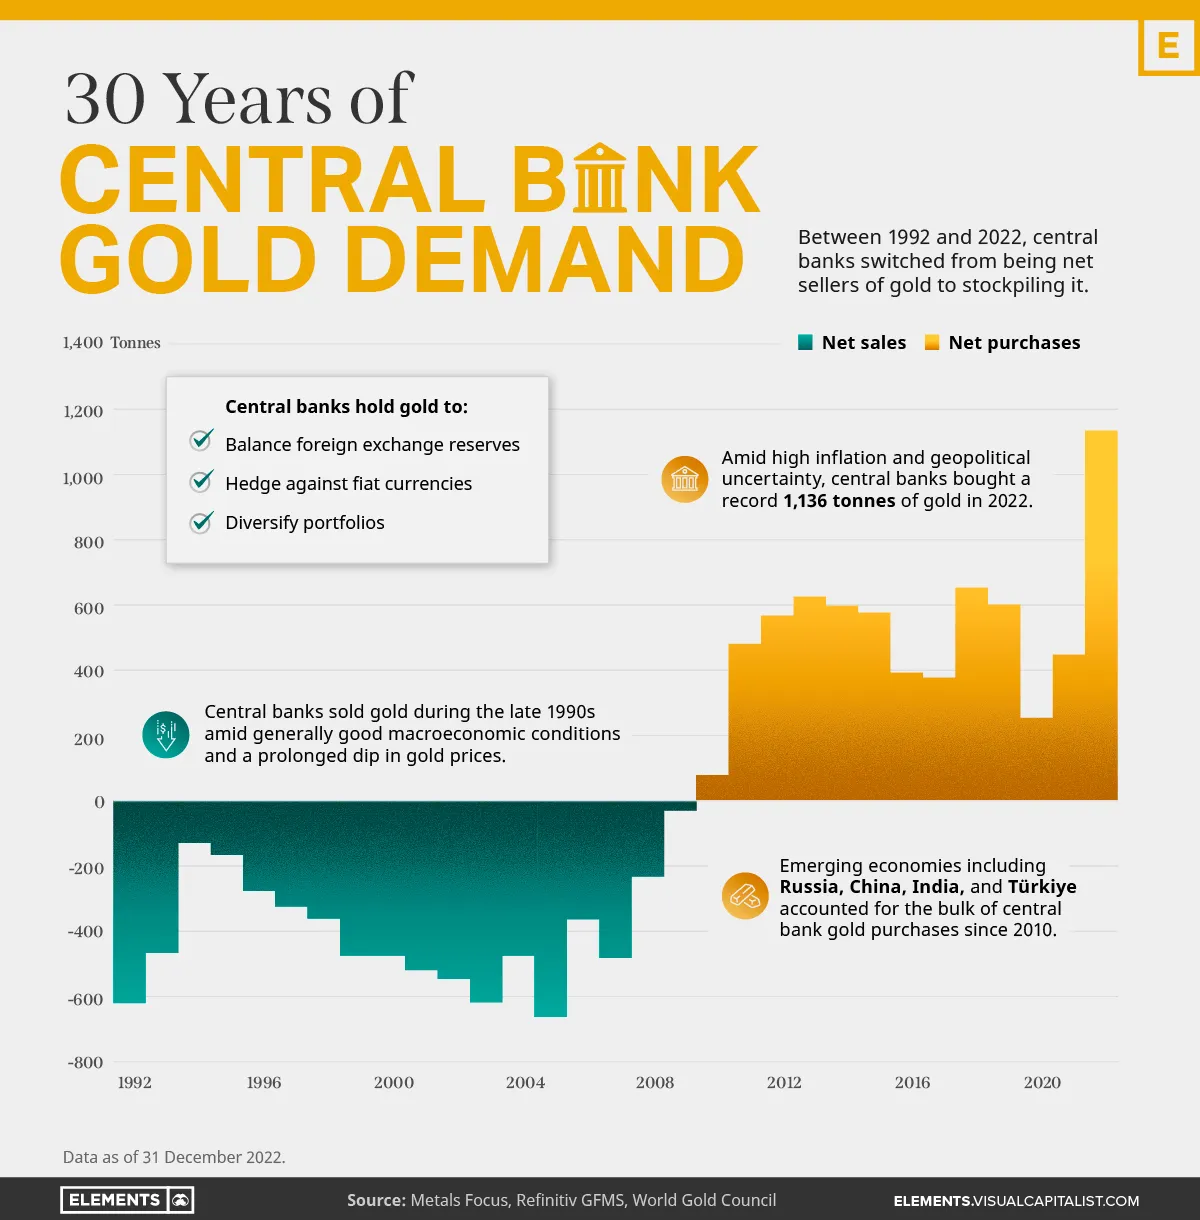
Gold demand from 1992 to 2022 – Courtesy of Elements-VisualCapitalist.
Government deficits are ever-increasing, even with a stable global economy, and the US seemingly cannot be as trustful of a global riches reserve, given the several diplomatic heatwaves provided by Donald Trump.
Tariffs aren’t the most welcomed policies if you want to retain buyers of your government bonds.
Particularly when you’re cutting rates.
In any case, since reaching its COVID lows in March 2020 ($1,451), Gold is up close to 200%, and most of its gains have occurred since February 2024.
However, what is grabbing Markets’ attention is how strong the acceleration has been ongoing since August 2025 and Powell’s Jackson Hole speech, which may have been a turning point for global Markets.
Let’s dive into a multi-timeframe Gold analysis to get a closer look on the post-FOMC rebound as the Yellow metal aims to protect its throne.
Gold (XAU/USD) Multi-Timeframe Analysis, Technical levels and Potential Price Targets
Daily Chart
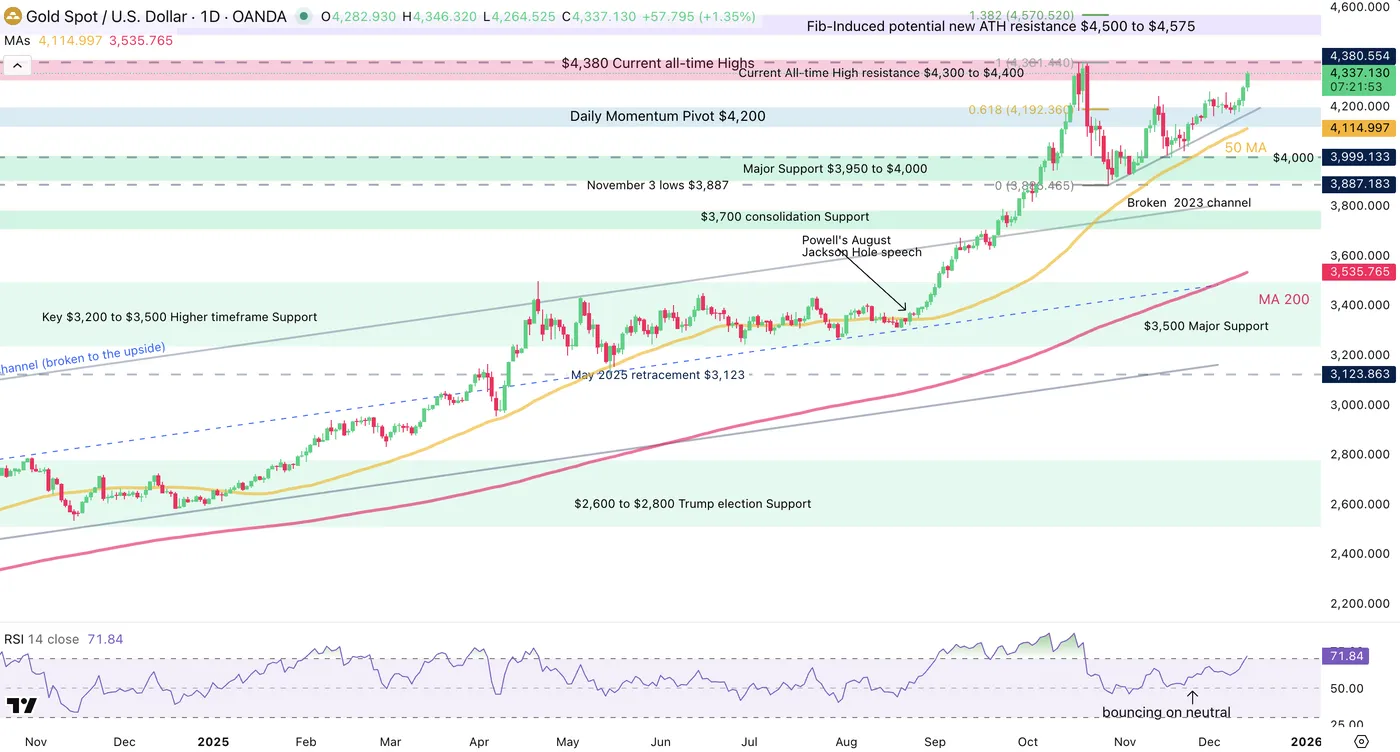
Gold (XAU/USD) Daily Chart. December 12, 2025 – Source: TradingView
Our pre-FOMC Metals analysis pointed to a potential breakout in Gold after a triangle consolidation – And it is currently playing out.
Bulls used the 50-Day Moving Average as support. Keep a close eye on it as it has been serving as loyal support throughout 2025.
The rest will be to see if buyers can make the push beyond new highs.
Up 3.75% in 3 sessions, momentum is gathering some heat despite some not-so-dovish 2026 Fed Cut projections – Until more data is served for Markets (Tuesday 16 – US NFP) not much can come to stop the rally.
Metal buyers just wanted to see rates coming down, and they are getting served.
Silver and its ongoing frenzy is dragging demand for such commodities higher.
An interesting Chart: Silver to Gold Ratio
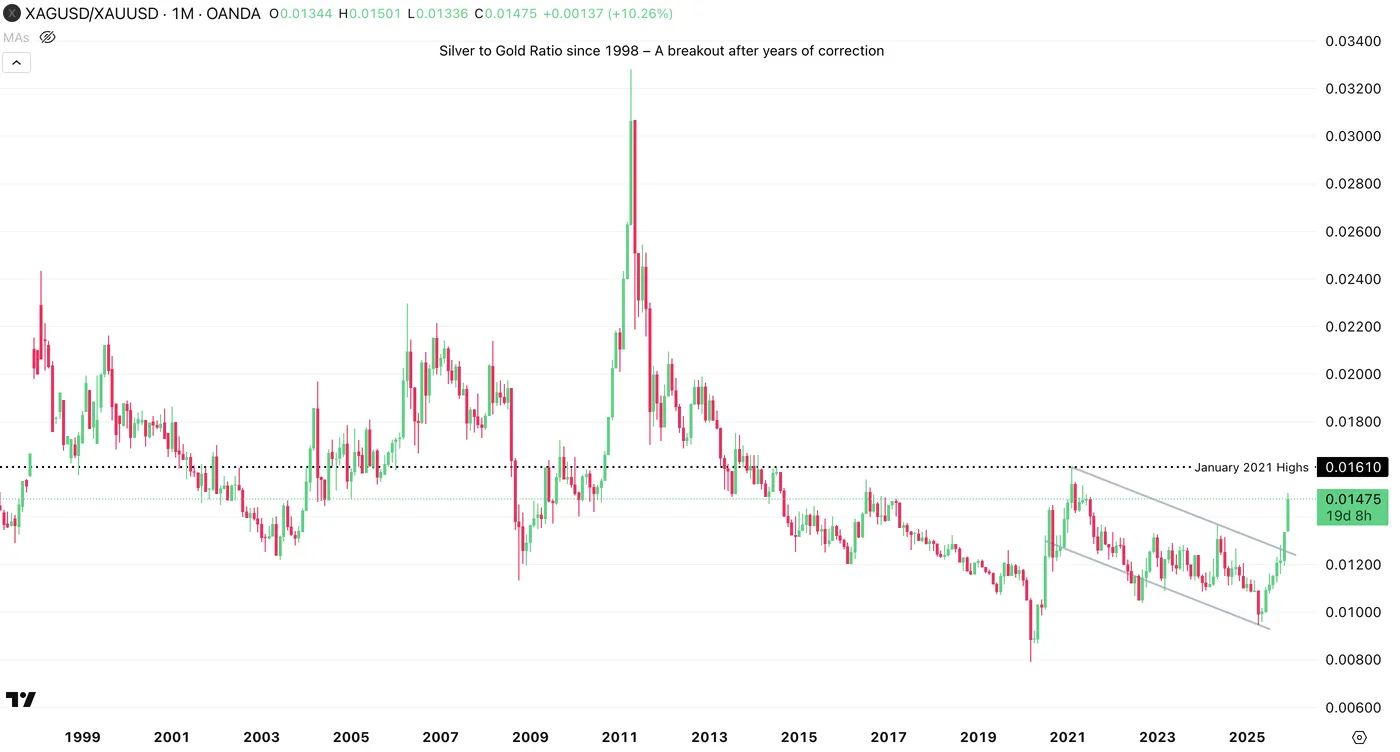
Silver to Gold Ratio – Monthly Chart. December 12, 2025 – Source: TradingView
4H Chart, Technical Levels and potential Price targets
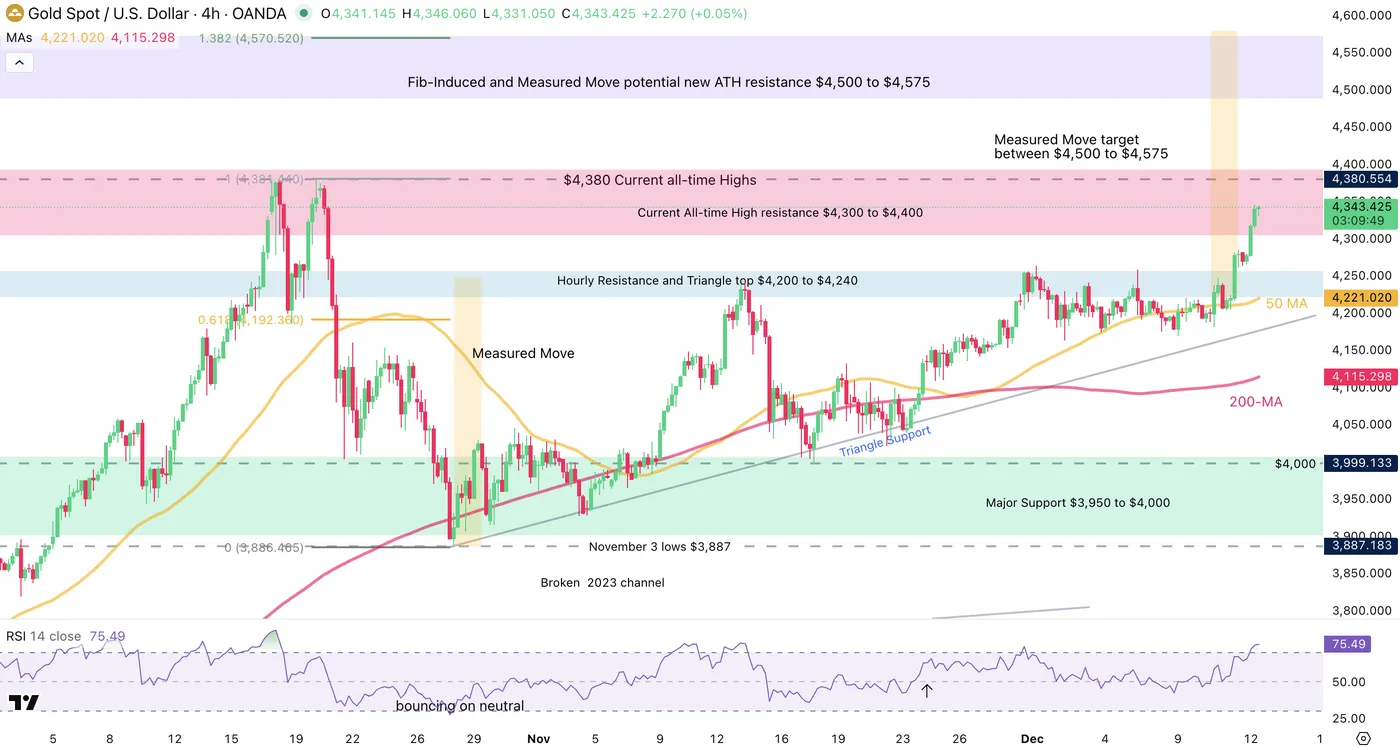
Gold (XAU/USD) 4H Chart. December 12, 2025 – Source: TradingView
As indicated in our recent piece (link just above), a measured move higher (Yellow squares) could take prices anywhere to $4,500 to $4,575 if buyers manage to break recent highs.
Levels to watch for Gold (XAU/USD) trading:
Resistance Levels
- Current All-time High resistance $4,300 to $4,400
- $4,380 Current all-time Highs
- Fib-Induced potential new ATH resistance $4,500 to $4,575
- Session highs $4,346 (and counting)
Support Levels
- Hourly Pivot and Triangle top $4,200 to $4,240
- 50-Day MA $4,150
- Major Pivot $3,950 to $4,000 (200-period MA)
- $3,700 consolidation Support
- $3,500 Major Support
1H Chart
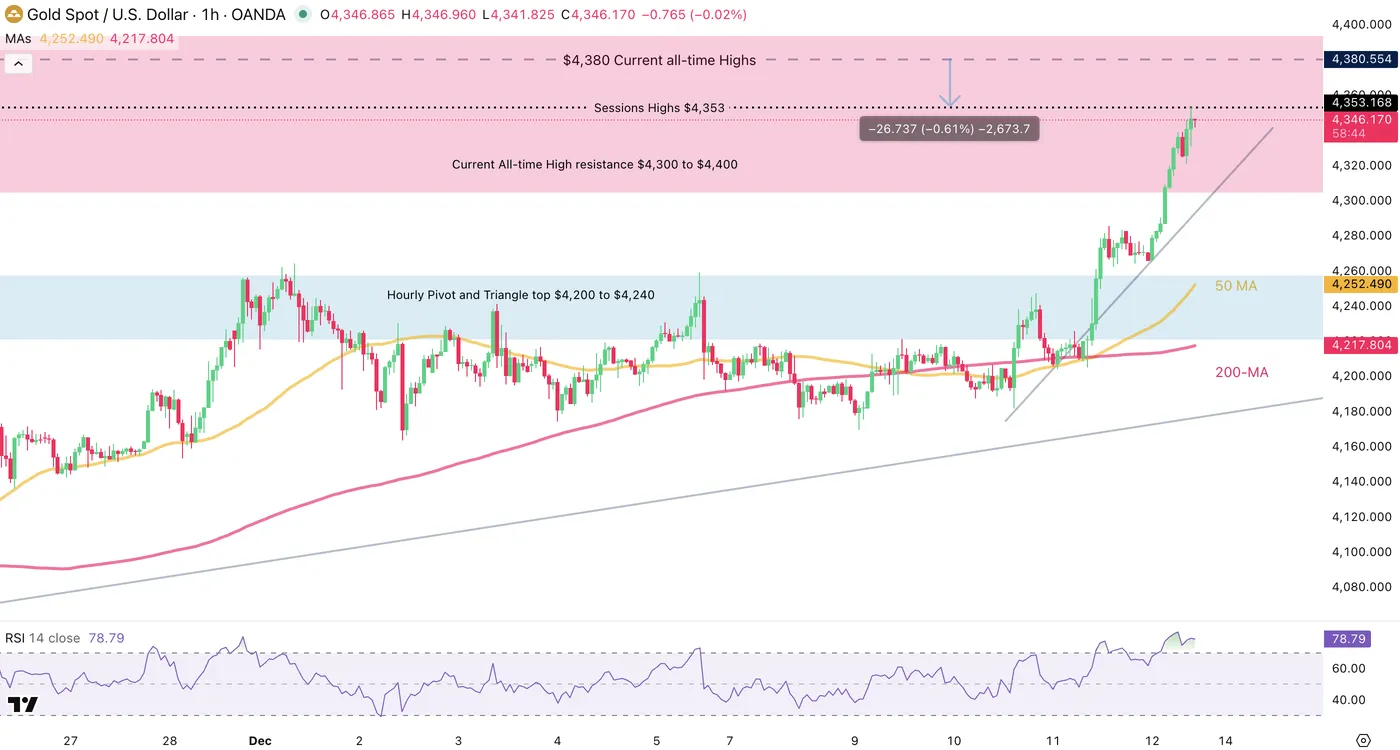
Gold (XAU/USD) 1H Chart. December 12, 2025 – Source: TradingView
Despite the overbought conditions on all timeframes, the rally isn’t showing signs of stopping.
Watch for any stalling of momentum however.
A consolidation between $4,300 to $4,350 provides higher chances of a breakout as the RSI slows down.
A retracement however points to a more balanced price action going forward.
Safe Trades!


