
Key takeaways
- Gold has entered a disorderly liquidation phase: Driven primarily by forced unwinding of leveraged long positions rather than a shift in Fed policy expectations.
- Margin hikes and order flows, not Fed politics, are the real catalyst: CME’s increase in gold and silver futures margin requirements sharply raised capital costs, choking off bullish risk appetite and triggering cascading sell-offs, while US 2-year yields signal no hawkish repricing.
- Near-term setup favours a tactical bounce, with clear risk levels: Gold is approaching the critical US$4,405 support, reinforced by multiple technical confluences and extreme volatility readings; a hold above this level opens scope for a minor mean-reversion rebound, while a break lower signals further downside.
The price actions of Gold (XAU/US) have staged the expected corrective decline on last Friday, 30 January 2026, to hit the second intermediate support at US$4,757 as highlighted.
The yellow precious metal printed an intraday low at US$4,679 and closed the US session at US$4,895 on Friday, 30 January 2026, recording a daily loss of 9%, its steepest drop since 1983.
Order flows are the main catalyst for the steep losses, not Kevin Warsh
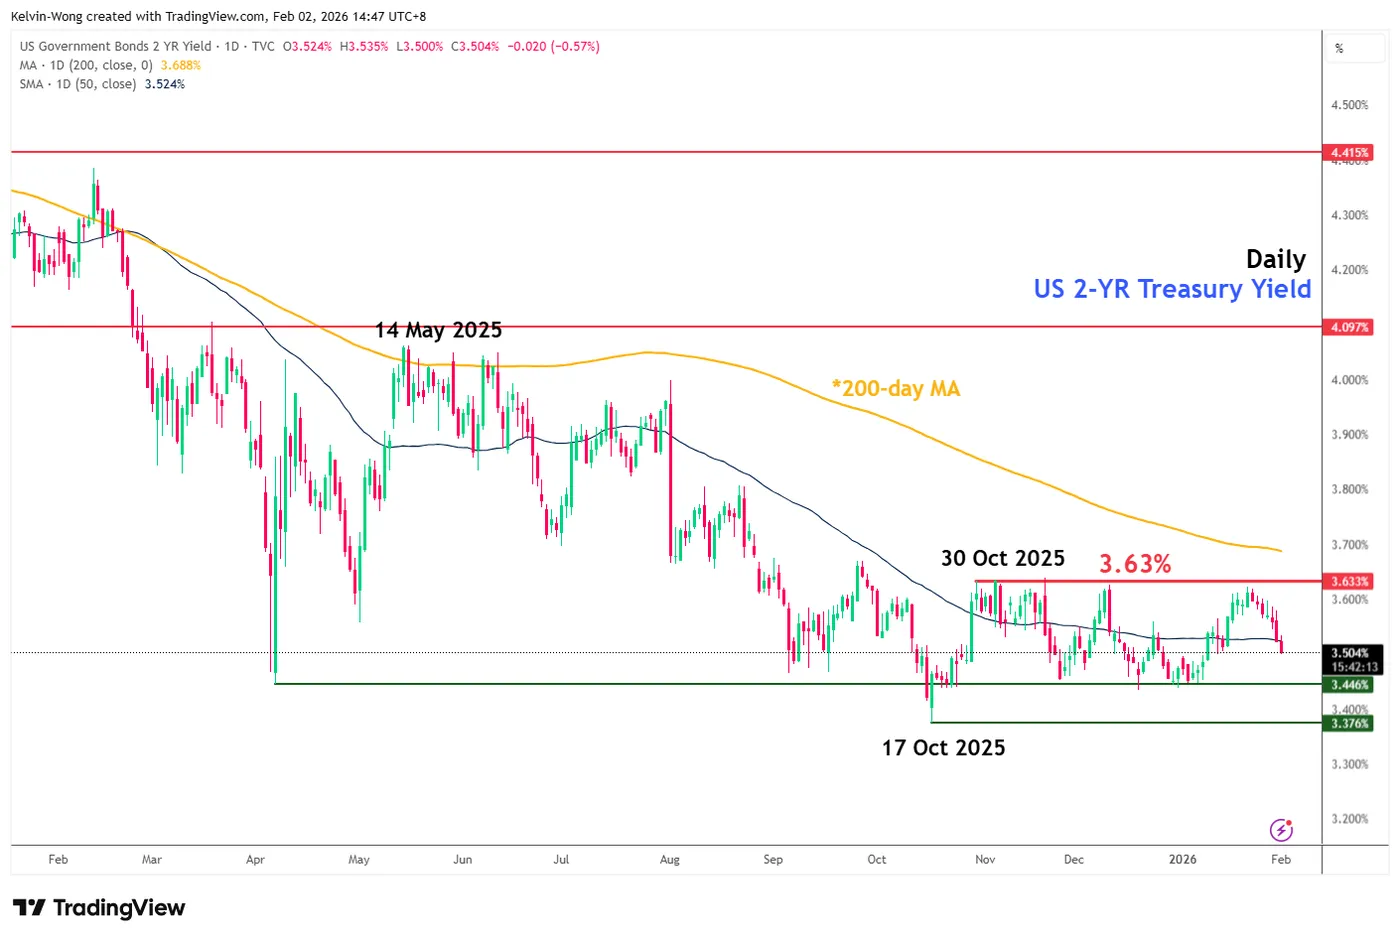
Fig. 1: 2-YR US Treasury yield medium-term trend as of 2 Feb 2026 (Source: TradingView)
Several media reports have highlighted that US President Trump’s official announcement to nominate ex-Fed governor Kevin Warsh as the new Fed Chair is likely the driver that triggered the rampant sell-off in gold and silver due to his past remarks on his preference for a smaller US Federal Reserve’s balance sheet, which may lead to an indirect tightening of liquidity conditions.
However, the US Treasury market does not imply such a narrative that “Kevin Warsh is going to be a new hawkish Fed Chair”.
The 2-year US Treasury yield, which is the most sensitive to the Fed’s monetary policy stance, did not trade higher last Friday; instead, it dropped by 4 basis points to close lower at 3.52%, and remained below the medium-term range resistance of 3.63% in place since 30 October 2025 (see Fig. 1).
In today’s Asia session, 2 February 2026, Gold (XAU/USD) has continued to extend its losses by 9% to print an intraday low of US$4.402 at the time of writing due to a hike in metal futures margins announced by CME Group over the weekend.
COMEX gold futures margins (1oz) are raised from 6 per cent to 8 per cent, while COMEX 5000 silver futures (SI) are set to increase to 15 per cent from 11 per cent.
Hence, such increases in margin requirements are likely lead to a further unwinding of speculative long positions in Gold and Silver.
Higher capital outlays to sustain or extend long positions abruptly choked off bullish risk appetite, unleashing a cascading liquidation in Gold (XAU/USD).
Let’s now look at the short-term technical chart to decipher the near-term (1 to 3 days) trajectory
Short-term trend (1 to 3 days): Minor mean reversion rebound after overextended decline
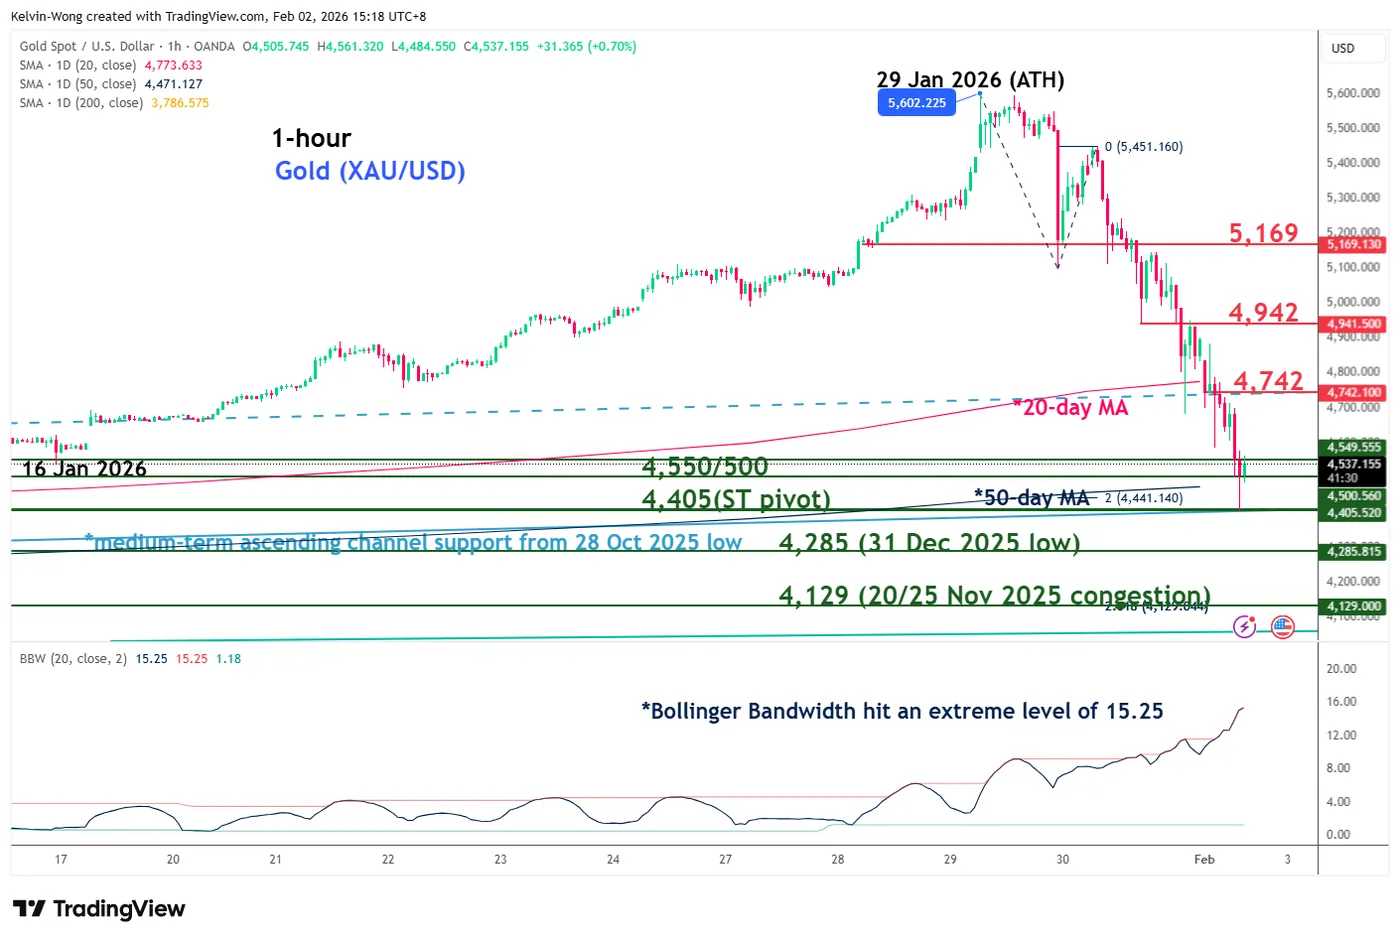
Fig. 2: Gold (XAU/USD) minor trend as of 2 Feb 2026 (Source: TradingView)
Watch the US$4,405 key short-term pivotal support on Gold (XAU/USD). A clearance above US$4,742 (also the 20-day moving average) is likely to increase the odds of a minor mean reversion rebound towards the next intermediate resistances at US$4,942 and US$5,169 (also the 61.8% Fibonacci retracement of the steep decline from 26 January 2026 all-time high to 2 February 2026 intraday low) (see Fig. 2).
However, a break and an hourly close below US$4,405 invalidates the minor bullish recovery scenario for a further extension of the corrective decline towards the next intermediate supports at US$4,285 and US$4,129.
Key elements to support the short-term bullish bias
- The US$4,405 key short-term pivotal support is defined by a confluence of different elements that point to a similar level of around US$4,405; the 50-day moving average, the lower boundary of a medium-term ascending channel from 28 October 2025, and a Fibonacci extension of the current drop, measured from the current all-time high of 29 January 2026.
- Hourly Bollinger Bandwidth has spiked to an extreme 15.25, indicating a volatility climax and suggesting the recent price sell-off is overextended in the near term.


