
Summary
Soaring gold prices and heavy overseas demand have pushed large volumes of physical gold out of the U.S., mechanically narrowing the trade deficit. But don’t mistake this for an economic improvement.
Gold transfers reflect asset reallocation under geopolitical stress, not real economic activity, which is why the Bureau of Economic Analysis largely strips it out of GDP. When gold is excluded, the trade deficit looks worse than the headline suggests.
All That Glitters Is Not Growth
From 2000 through 2020, the spot price of gold averaged less than $1,000 per ounce. In 2020, gold broke above $2,000 for the first time. By March 2025 it crossed $3,000, by October it surpassed $4,000, and today gold is trading near $5,000 per ounce.
Gold and other precious metals are now at- or near-record highs as investors and central banks seek protection from geopolitical risk, policy uncertainty, and declining real interest rates. Offering forward‑looking price guidance is outside the scope of this report. The boneyard of economists who have tried to forecast gold prices is already crowded enough without adding ours to the pile.
What matters for understanding gold right now is not the price forecast, but the composition of demand. The appetite for gold is increasingly being driven by large institutional buyers and ETFs, as well as by overseas investors. Some crypto‑related firms are also purchasing physical gold to back gold‑linked tokens.1 As a result, substantial quantities of gold are being shipped out of the United States.
This surge in precious-metals exports has mechanically narrowed the U.S. trade deficit. Under normal circumstances, a narrowing trade deficit would be supportive of measured GDP growth. In this case, however, appearances are misleading.
The reason is straightforward: most gold moving across borders reflects asset reallocation, not real economic activity. Non‑monetary gold trade does not represent the production of new goods or services, so it does not meaningfully contribute to GDP. Consequently, the recent “gold rush” will not show up as stronger economic growth, even though it is having a visible impact on headline trade statistics.
This distinction matters because it underscores why the apparent “normalization” in the trade deficit is anything but.
Why Gold Trade Is Largely Excluded From GDP
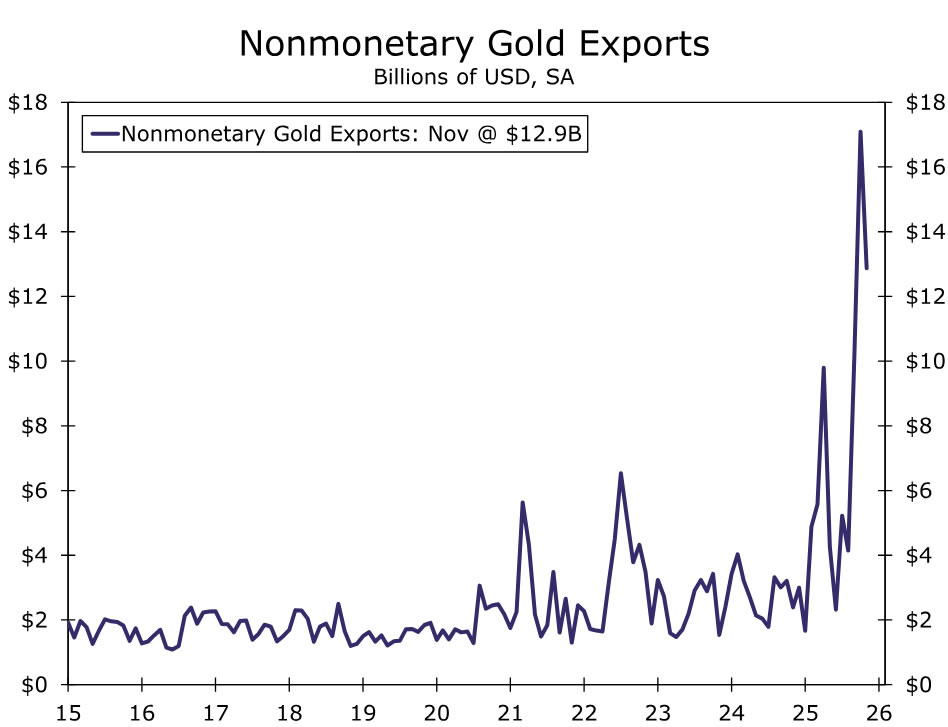
The Bureau of Economic Analysis (BEA) is tasked with measuring economic production, not the reshuffling of existing assets. Gold generally serves one of two purposes: it is either used as an input into production (for example, jewelry or electronics), or it is held as a store of value (bullion, bars, and coins). The bulk of gold crossing borders lately falls squarely into the second category (Figure 1).
Because most non‑monetary gold trade represents investment flows rather than production, the BEA strips gold imports and exports out of GDP. Instead of relying on volatile trade flows, the BEA uses a simpler proxy for gold net exports: domestic gold production minus industrial use.2 Under normal conditions, this adjustment is small enough to go unnoticed. When gold trading surges, however, the wedge between headline trade data and GDP‑relevant activity can become large.
That is precisely what is happening now. Large swings in gold imports and exports are distorting the trade numbers without signaling any meaningful change in underlying economic activity.
What the Latest Trade Data Show
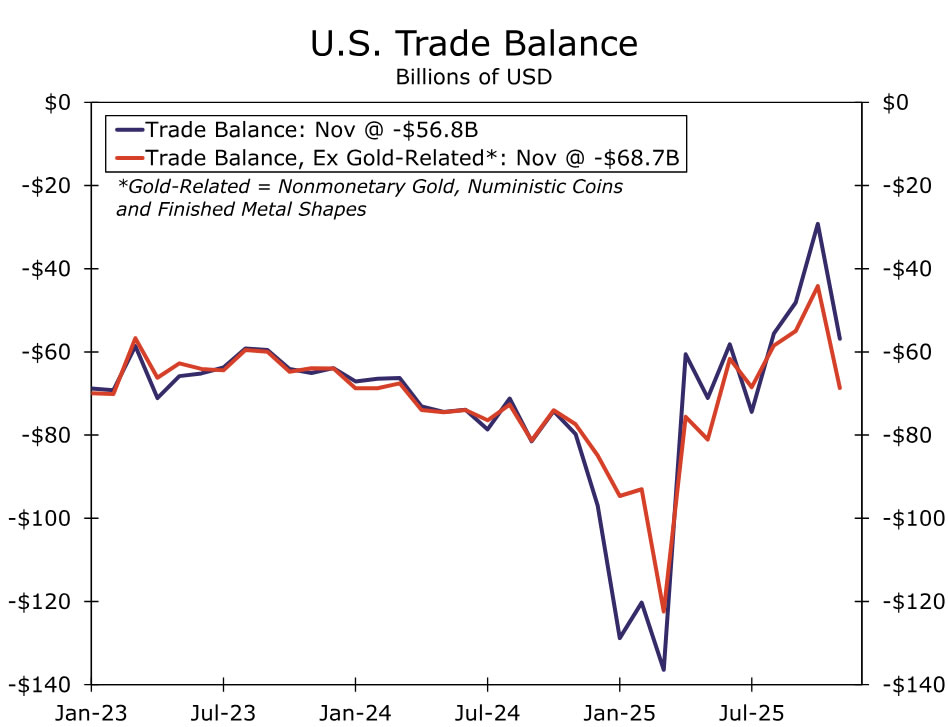
If non-monetary gold—along with a small handful of other investment‑driven categories—is excluded from both exports and imports, the trade deficit is actually wider than headline figures suggest by almost $12 billion (Figure 2).3 The gold trade has been masking ongoing imbalances rather than resolving them. A similar dynamic was at play in late 2024/early 2025, when imports of finished metal shapes surged ahead of expected tariff increases.
Two components are almost entirely responsible for the surge in gold exports today: bullion (unmarked or minimally processed gold) and gold bars.
Bullion exports have been running at more than twice their typical volume. Over the past three months, an average of roughly 75 metric tons of gold bullion has left the United States each month, compared with a post‑pandemic monthly average closer to 30 metric tons. While this series has always been volatile, recent outflows have clustered near the upper end of the historical range.
The move in gold bars has been far more dramatic. For several years through mid‑2025, gold bar exports averaged just 0.5 metric tons per month. That changed abruptly in late summer. Gold bar exports surged to approximately 11 metric tons in September—a more than sixteen‑fold increase—before jumping again to over 50 metric tons in October. Exports then collapsed back toward trend in November.
When combined with soaring prices, these volume swings become even more striking in dollar terms. A sixteen‑fold increase in the physical quantity of gold bars exported in September translated into roughly a twenty‑fold increase in their dollar value. In other words, the volatility in gold exports reflects not just higher prices, but unusually large movements of physical metal out of the country.
Bottom Line
Gold’s role in the recent trade data is a reminder that not all cross‑border flows are created equal. Capital moving to shelter looks very different from goods moving to market, even if both pass through the same statistical tables. The BEA’s treatment of non‑monetary gold is not a technical footnote—it is a recognition of that fundamental distinction.
For readers of the data, the takeaway is simple but important: a narrower trade deficit driven by gold exports is not evidence of renewed economic strength. It is evidence of caution. And in moments like this, separating signal from shine matters more than ever.
Endnotes
1 – Reuters and Bloomberg both quote interviews with Paolo Ardonio, the CEO of Tether, about adding several tons of physical gold to its storage sites in Switzerland.
2 – See “How Are Exports and Imports of Nonomonetary Gold Treated in BEA’s National Economic Accounts?” for more detail.
3 – The BEA BOP-basis category of non-monetary gold adds the census-basis categories of non-monetary gold (end-use code 12260 for exports and 14270 for imports), numismatic coins (end use 41300), and finished metal shapes (end use 12300 for exports, 15200 for imports) and then a separate BOP adjustment for gold transactions not captured by the Customs Protection Bureau. Note, this last category is not something we proxy in our gold-adjusted trade balance in Figure 2.


