
Key Highlights
- Ethereum remained in a range above the $1,850 support.
- A rising channel is forming with support at $1,865 on the daily chart of ETH/USD.
- Bitcoin price started a fresh recovery wave above $68,000 and $68,500.
- XRP is consolidating above the key support at $1.3350.
Ethereum Technical Analysis
Ethereum failed to surpass $2,200 and trimmed gains. ETH declined below $2,050 but remained in a range above the $1,850 support.
Looking at the daily chart, the price again failed to clear the 23.6% Fib retracement level of the downward move from the $3,400 swing high to the $1,740 low. There is also a rising channel forming with support at $1,865.
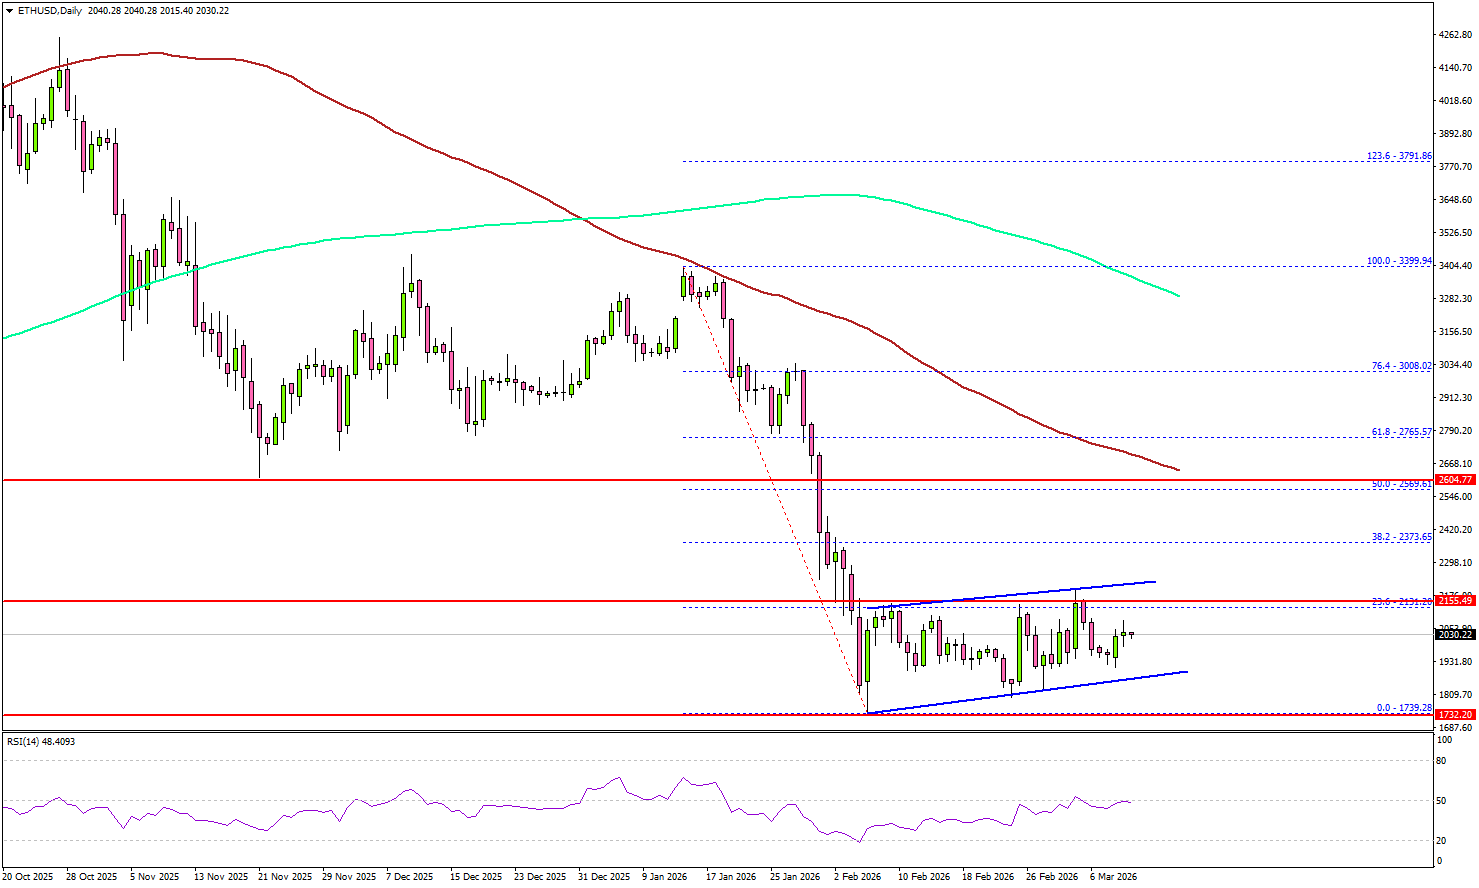
On the upside, the bears might remain active near $2,120. The first key resistance could be near the $2,155 level. The main hurdle for bulls sits near $2,200.
A close above the $2,200 level could open doors for a larger upward movement. In the stated case, ETH could rise toward the 50% Fib retracement level of the downward move from the $3,400 swing high to the $1,740 low at $2,570 and the 100-day simple moving average (red).
On the downside, the bulls might be active near $1,950 and $1,920. The main support is now forming near $1,865, below which the price could slide toward $1,750. Any more losses might call for a move toward $1,650.
Looking at Bitcoin, there was another recovery wave, but the bears remained active below the $72,000 resistance zone.
Economic Releases
- US Consumer Price Index for Feb 2026 (MoM) – Forecast +0.3%, versus +0.2% previous.
- US Consumer Price Index for Feb 2026 (YoY) – Forecast +2.4%, versus +2.4% previous.
- US Consumer Price Index Ex Food & Energy for Feb 2026 (YoY) – Forecast +2.5%, versus +2.5% previous.


