
- The US Dollar rallied consequently since the beginning of the US-Iran conflict, supported by the rise in Oil prices
- Now reaching the top of its long-term range, a major reversal could be coming
- Post-FOMC Dollar Index technical analysis
The World’s reserve currency has proved once again why, when it all blows up, it all comes back to the Dollar.
The USD serves as the denominator for global commodity trade, so when commodities suddenly appreciate, particularly Crude Oil, it tends to force large currency conversions towards it. Many economic actors rushed to hedge against the conflict by buying more expensive energy commodities, creating a dollar demand cascade.
That’s why it’s common to see the term ‘Petrodollar’ in recent days.
But this move could already be over as traders prepare for the second phase of the conflict, after three weeks of consistent gains.
Note: A crazy selloff is currently ongoing in the Dollar as Israel’s PM Netanyahu marks the advancement of the conflict, and Hawkish Central Banks lead to a large FX repricing.
The FOMC brought quite a lot of change to markets: Jerome Powell pushed against further rate cuts, citing inflation still too elevated and supply shocks that hurt dovish prospects.
But one thing that drove this move was the fact that he wasn’t particularly supportive of rate hikes – which gave bears enough leeway to stop the rush into the Greenback.
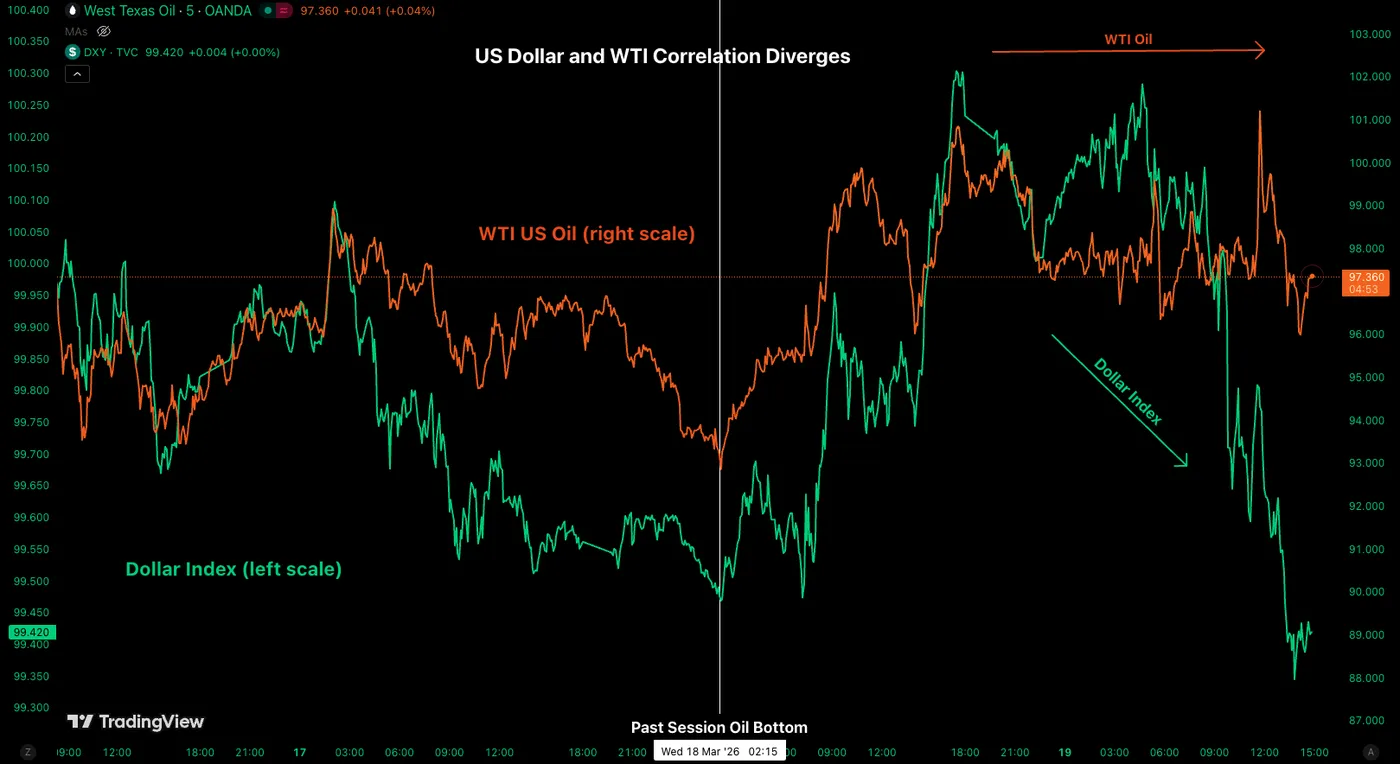
US Dollar and WTI Oil Correlation (breaking) – Source: TradingView
Having now reached the top of its July 2025 range, the US Dollar could now be heading for a large correction. But the range highs aren’t the only element marking the change in the recent flows.
The US Dollar and Crude Oil correlation is not as solid as it used to be – so expect to see more of these changes as time goes on.
As you can see on the correlation Chart above, since yesterday, WTI has remained sideways while the US Dollar tumbled – this is a significant change compared to the first half of the month.
We’ll explore the current technical signs arising and more in an in-depth technical analysis of DXY.
Dollar Index (DXY) Multi-Timeframe Analysis
Daily Chart
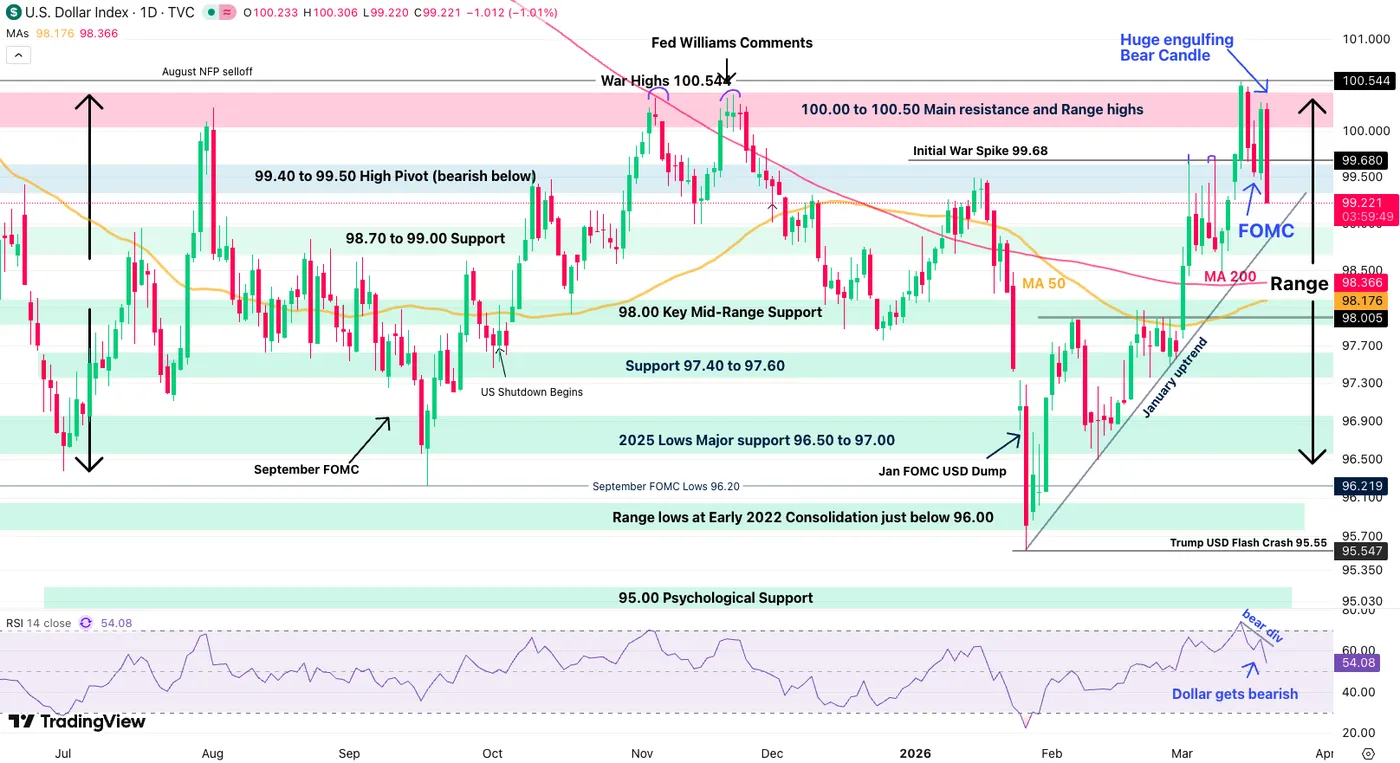
Dollar Index (DXY) Daily Chart. March 19, 2026 – Source: TradingView
Traders who followed my Dollar Analysis since have seen extensively how significant the ongoing range is – No matter how bearish traders and newspapers got on the US Dollar, it refused to break its support.
And now we are rejecting its highs. The ongoing move is spectacular, with an enormous reversal currently ongoing, forming a large bearish engulfing candle which should put back the Dollar into short-term bearish territory.
The long-term range spans from ~96.00 to ~100.00
As a reminder, the Dollar Index serves to get a better idea of what directions to look in other FX pairs like EUR/USD, GBP/USD and others – The rest is for you to find which pairs have the most interest for reversal.
4H Chart and Technical Levels
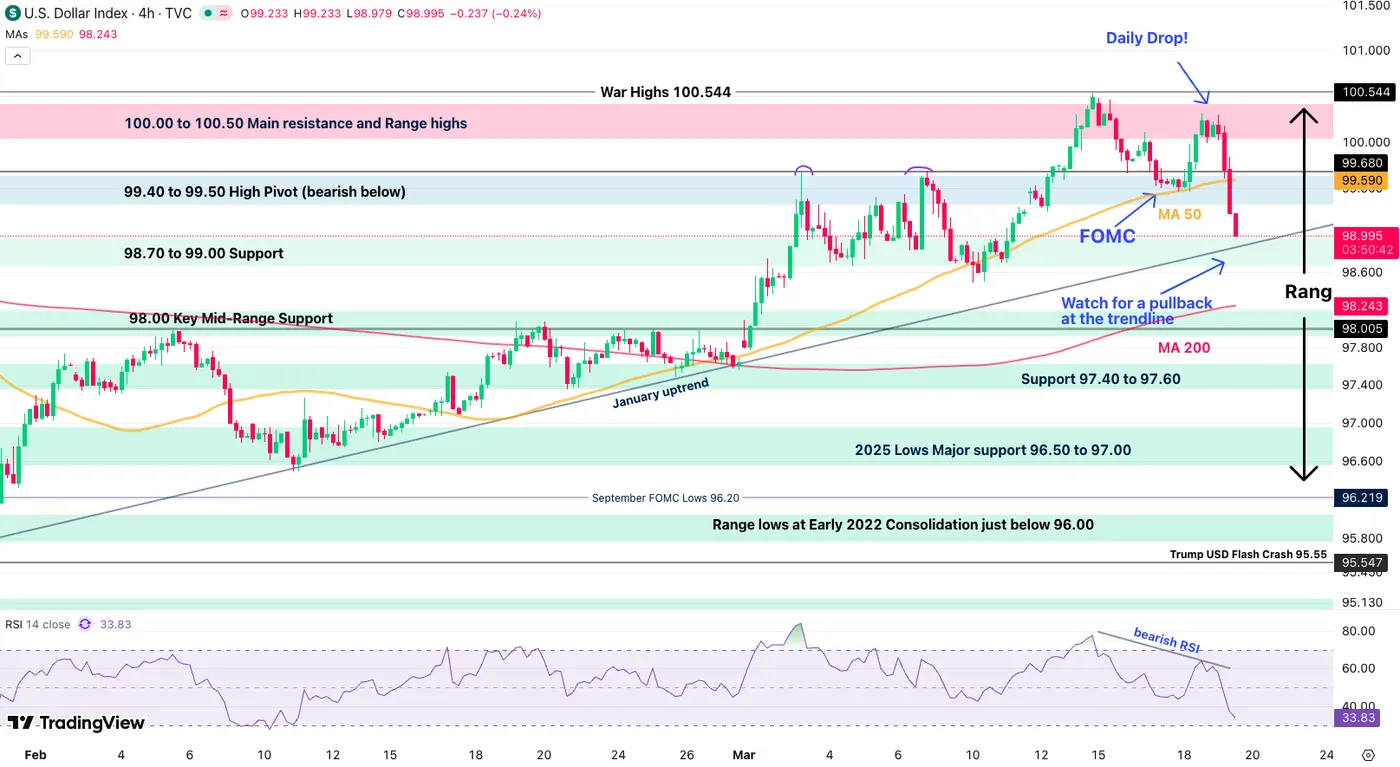
Dollar Index (DXY) 4H Chart. March 19, 2026 – Source: TradingView
The ongoing reversal in the US Dollar is significant! Watch out for reactions to the 99.00 level and January trendline.
A rebound could go retest the 99.40 to 99.50 Pivot Zone. – Going short the US Dollar could be interesting in that event.
Levels to place on your DXY charts:
Resistance Levels
- 100.00 to 100.50 Main resistance and Range highs
- 4H 50-period MA 99.59
- 99.40 to 99.50 High Pivot (bearish below, watch for a retest)
- War Highs 100.544
Support Levels
- 98.70 to 99.00 Support (immediate test – Jan trendline 98.88 + bearish if breaks)
- 98.00 Key Mid-Range Support, below hints at 97.00
- Support 97.40 to 97.60
- 2025 Lows Major support 96.50 to 97.00
- Trump USD Flash Crash 95.55
1H Chart
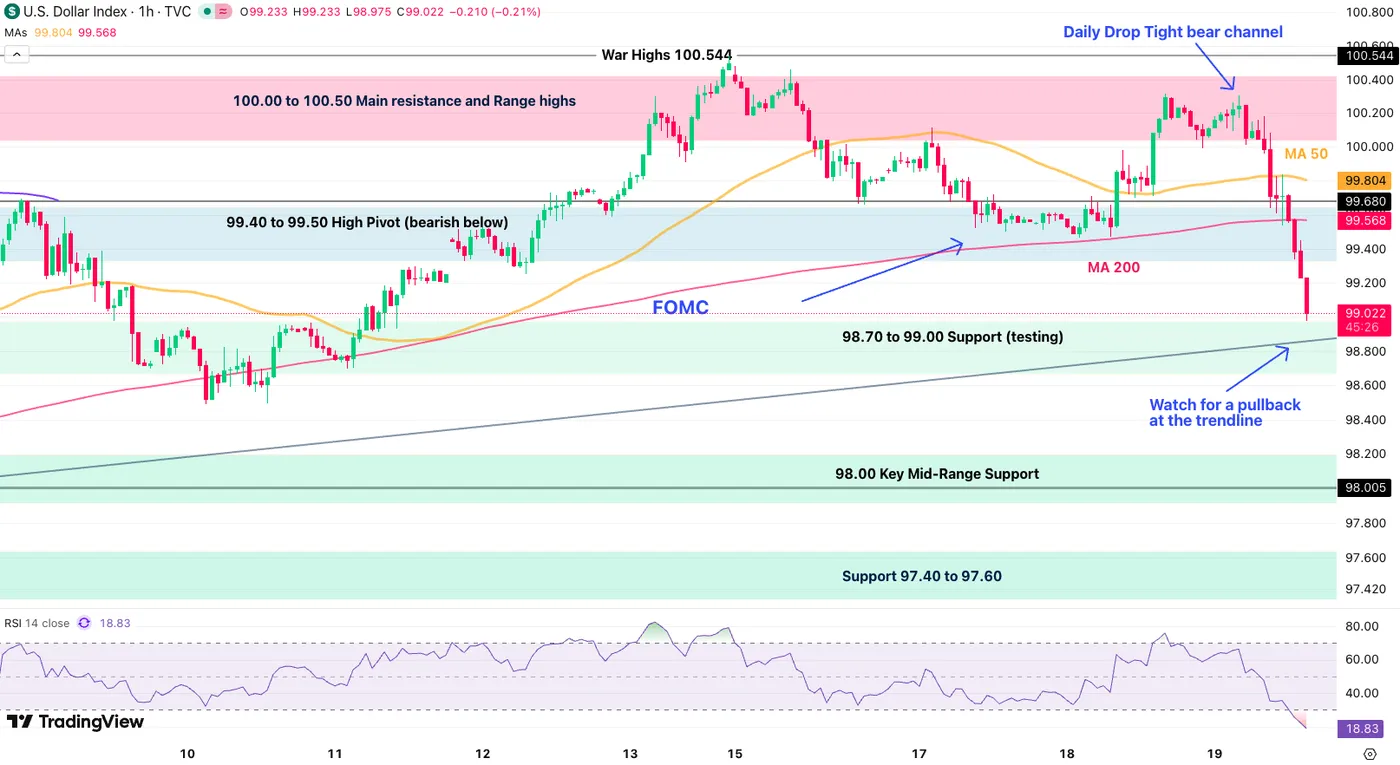
Dollar Index (DXY) 1H Chart. March 19, 2026 – Source: TradingView
The US Dollar is now forming a tight bear channel – Reaching the 99.00 support, a small reversal wouldn’t be surprising.
Watch for entry points in other US Dollar FX pairs on pullbacks.
Safe Trades and keep track of the Middle East conflict and WTI!


