
- UK annual inflation held steady at 3% in February 2026, matching the previous month’s figure.
- The Bank of England (BoE) faces a policy dilemma as public inflation expectations soar amid war fears and manufacturing cost increases.
- The GBP/USD pair remained largely flat, trading in a “squeeze” between key moving averages, which suggests an imminent technical breakout is likely.
Data from the ONS showed the UK’s annual inflation rate held firm at 3% in February 2026, matching the previous month’s figure and meeting market expectations. This consistency marks a continued period of relative stability, with inflation remaining at its lowest point since March 2025. While the headline figure remained unchanged, the underlying data revealed shifting price pressures across various sectors.
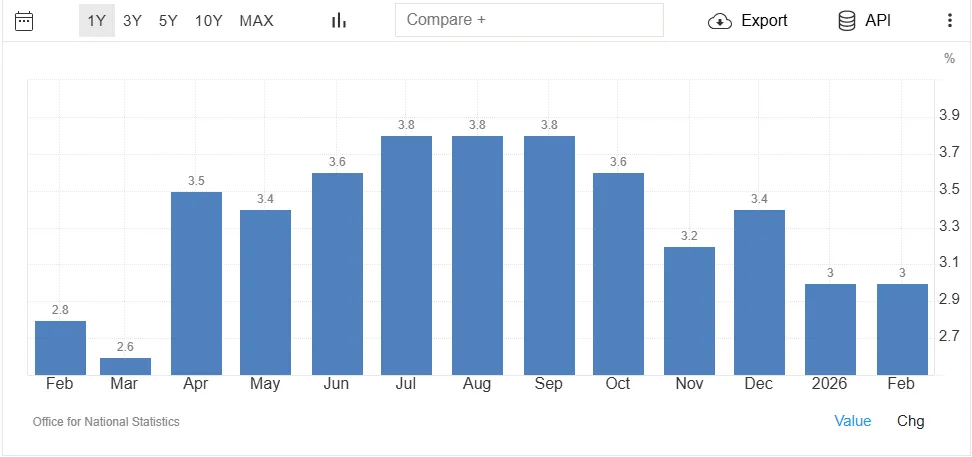
Source: TradingEconomics
Primary Drivers of Price Growth
The most significant upward pressure came from the clothing and footwear sector, which saw prices climb by 0.9%. This represents the first increase in four months, largely driven by the seasonal arrival of new spring collections following the conclusion of January sales. Additionally, costs for housing and utilities experienced a slight acceleration, rising to 4.6% from 4.5% in January.
Sectors Seeing a Slowdown
Conversely, several categories helped keep the headline rate in check:
- Transport: Prices slowed to 2.4% (down from 2.7%), primarily due to a drop in motor fuel costs. Petrol prices fell by 1.6 pence per litre this month, a sharp contrast to the 2.0 pence per litre increase seen during the same period last year.
- Essential Goods and Leisure: Food inflation eased to 3.3%, while recreation and culture slowed slightly to 2.5%.
- Hospitality and Services: Costs for restaurants and hotels cooled to 4%, and the closely watched services inflation rate ticked down to 4.3%.
Overall, the data suggests a balancing act where rising retail and housing costs are being offset by cheaper fuel and a gradual cooling in service and food prices.
Inflation expectations soar on Iran war fears
The Bank of England (BoE) faces an increasingly complex policy environment as new data released on Tuesday revealed a surge in public inflation expectations. This shift in sentiment compounds an already difficult situation for policymakers, as manufacturers have reported their sharpest cost increases since 1992, pressures that are expected to be passed on to consumers in the near future.
Household energy tariffs are currently capped, a scheduled price adjustment in July looms as a significant upcoming catalyst for further inflation. These mounting pressures have created a notable divide between market participants and economic forecasters regarding the BoE’s next move.
As of Tuesday per LSEG data, investors were pricing in nearly three quarter-point interest rate hikes before the end of the year to combat rising prices. This should keep GBP partially supported in the interim.
However, any significant escalation to tensions in the Middle East could see the US Dollar surge once more and this could drag on cable.
The initial market reaction
Markets seemed to shrug off today’s data with GBP/USD remaining largely flat after the release.
Looking at the bigger picture technical outlook, GBP/USD is caught between long-term bearish momentum and a recent short-term recovery.
The pair is currently trading in a “squeeze” between two critical Simple Moving Averages (SMAs). While the price has recovered from its mid-March lows, it remains capped by the 200-period SMA (dark blue) at 1.34567, which is currently acting as dynamic resistance.
Conversely, the 100-period SMA (light blue) at 1.33560 has shifted from resistance to support, providing a floor for the recent price consolidation. The narrow range between these two averages suggests an imminent breakout is likely as the price searches for a definitive direction.
The path of least resistance appears slightly tilted to the downside unless the bulls can clear and close above the 1.34500 – 1.35000 resistance cluster. A rejection at the 200 SMA could lead to a retest of the 1.3333 support.
However, if the price holds above the 100 SMA, we may see further consolidation before a breakout attempt.
GBP/USD H4 Chart, March 25, 2026
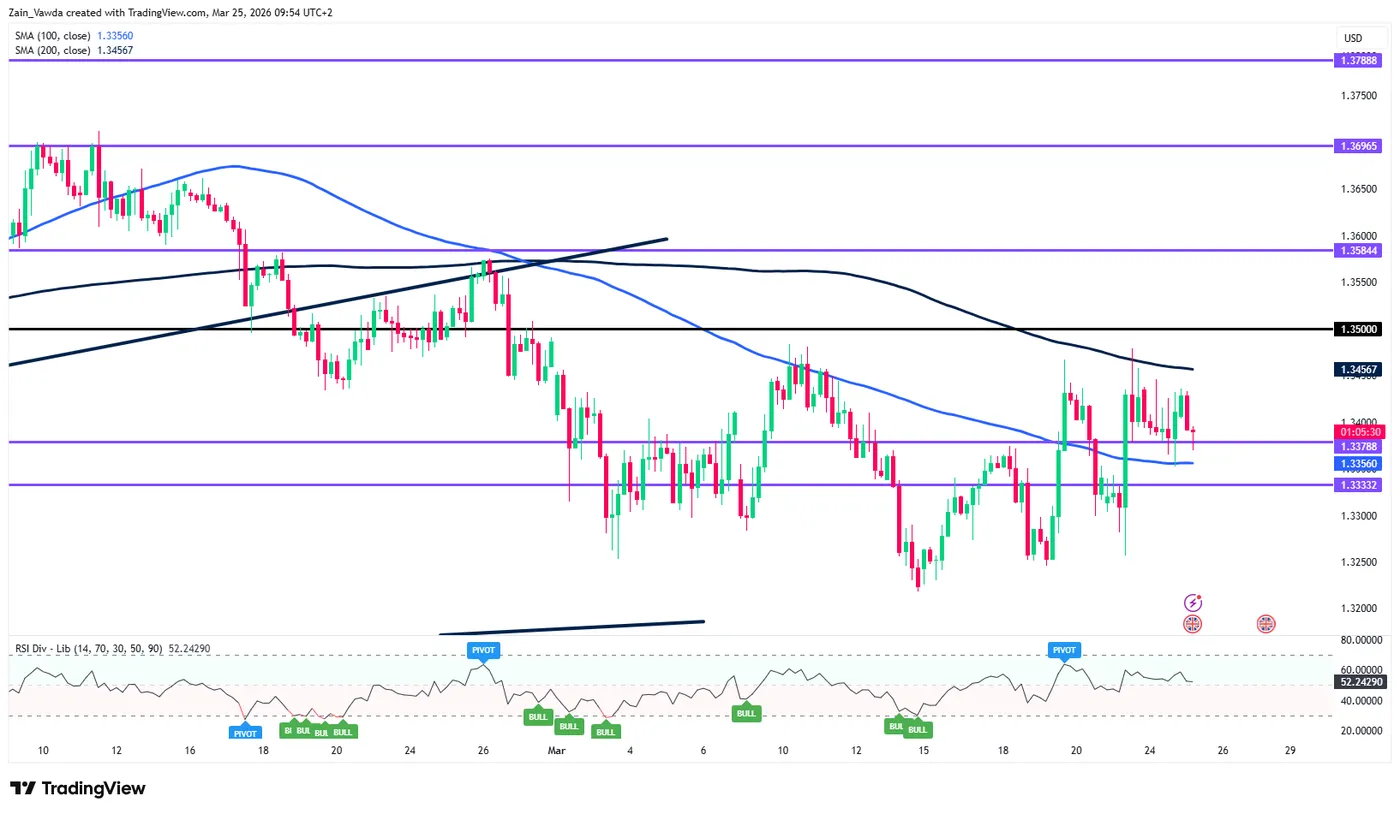
Source: TradingView.com


