
Key takeaways
- Rally likely a “dead cat bounce”: The sharp surge across US indices appears driven by short-covering and quarter-end positioning amid optimism over a potential US–Iran de-escalation, rather than a sustainable bullish reversal.
- Macro and technical backdrop still bearish: Longer-term charts show bearish reversal patterns across major indices, signalling deterioration in the broader uptrend despite the recent rebound.
- Weak breadth and key resistance levels cap upside: Market breadth remains fragile with limited participation, while indices are still below critical resistance levels (S&P 500 – 6,730), (Nasdaq 100 – 24,355), (DJIA – 47,460), leaving downside risks intact unless these levels are decisively reclaimed.
On Tuesday, 31 March 2026 (the last day of the month and the first quarter), the global markets witnessed a set of magnificent rallies on the four major US benchmark stock indices: S&P 500 (+2.9%), Nasdaq 100 (+3.4%), Dow Jones Industrial Average (+2.5%), and small-cap Russell 2000 (+3.4%), all notched their best daily performance since May 2025.
These explosive V-shaped intraday rallies seen in the US stock market were ignited by optimism of a potential de-escalation of the ongoing five-week US-Iran war.
Iranian President Masoud Pezeshkian told EU Council president António Costa that Iran has “the necessary will to end this war” but expects certain guarantees in exchange, a hint that the Iranian leadership may be open to negotiations.
Thereafter, towards the end of Tuesday’s US session, US President Trump mentioned that the US-Iran war may end within two to three weeks, suggested the US has accomplished its military goals, and the reopening of the Strait of Hormuz may not be necessary to end the war.
On Wednesday, 1 April at 9 p.m. Washington time, US President Trump will deliver an official speech to address the current situation in Iran, according to the White House’s press office.
Interestingly, the rallies seen on the major US stock indices can be due to short-covering and potential window-dressing for month-end and quarter-end.
Technical analysis suggests a potential mean reversion rebound (a dead cat bounce) rather than the start of a medium-term bullish reversal inflection point. Let’s break it down.
Longer-term price actions are bearish
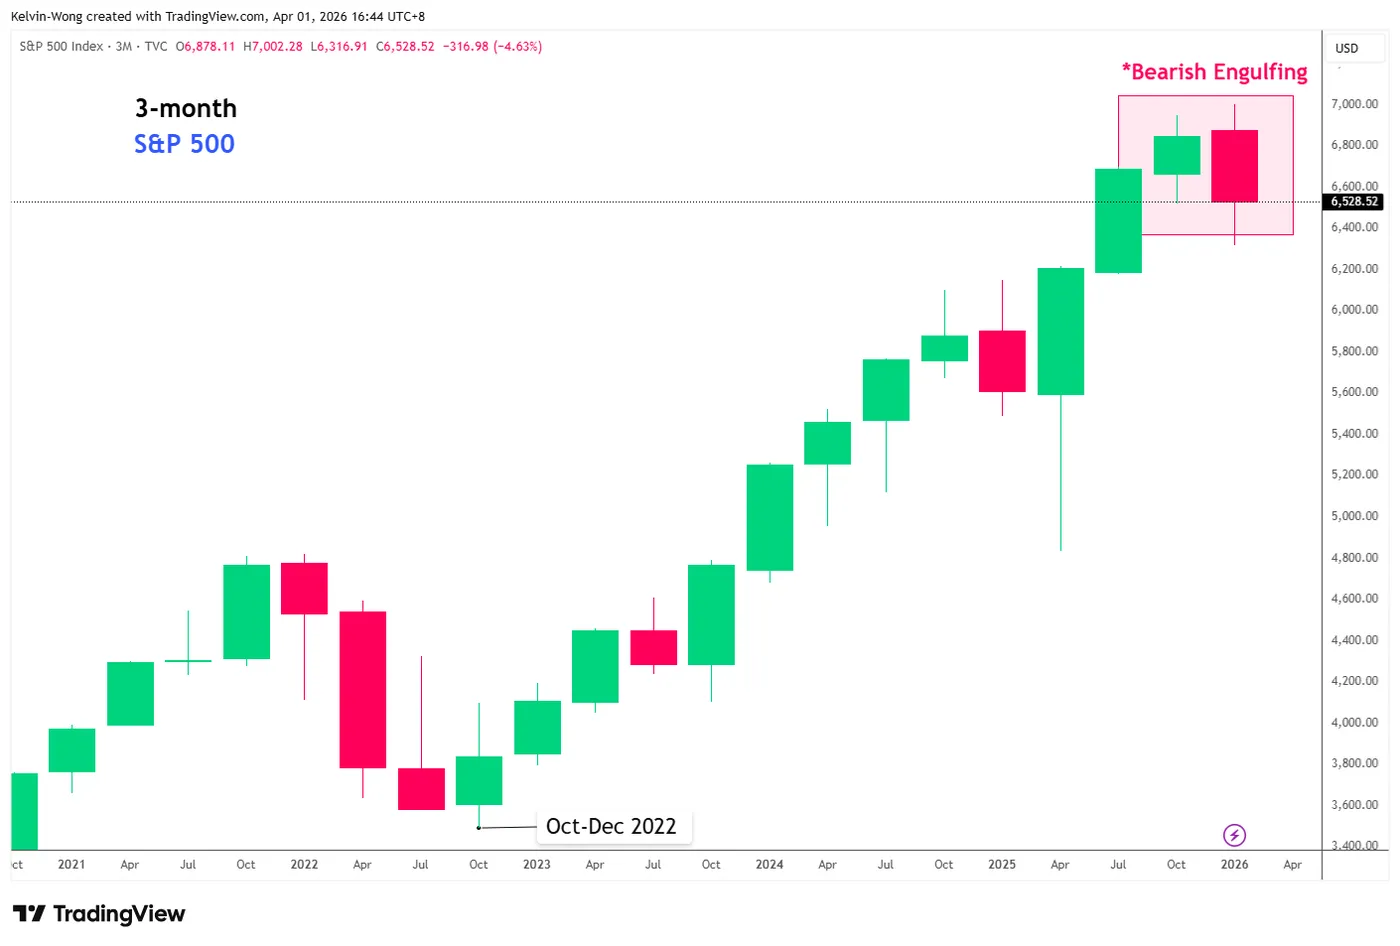
Fig. 1: S&P 500 long-term secular trend as of 31 Mar 2026 (Source: TradingView)
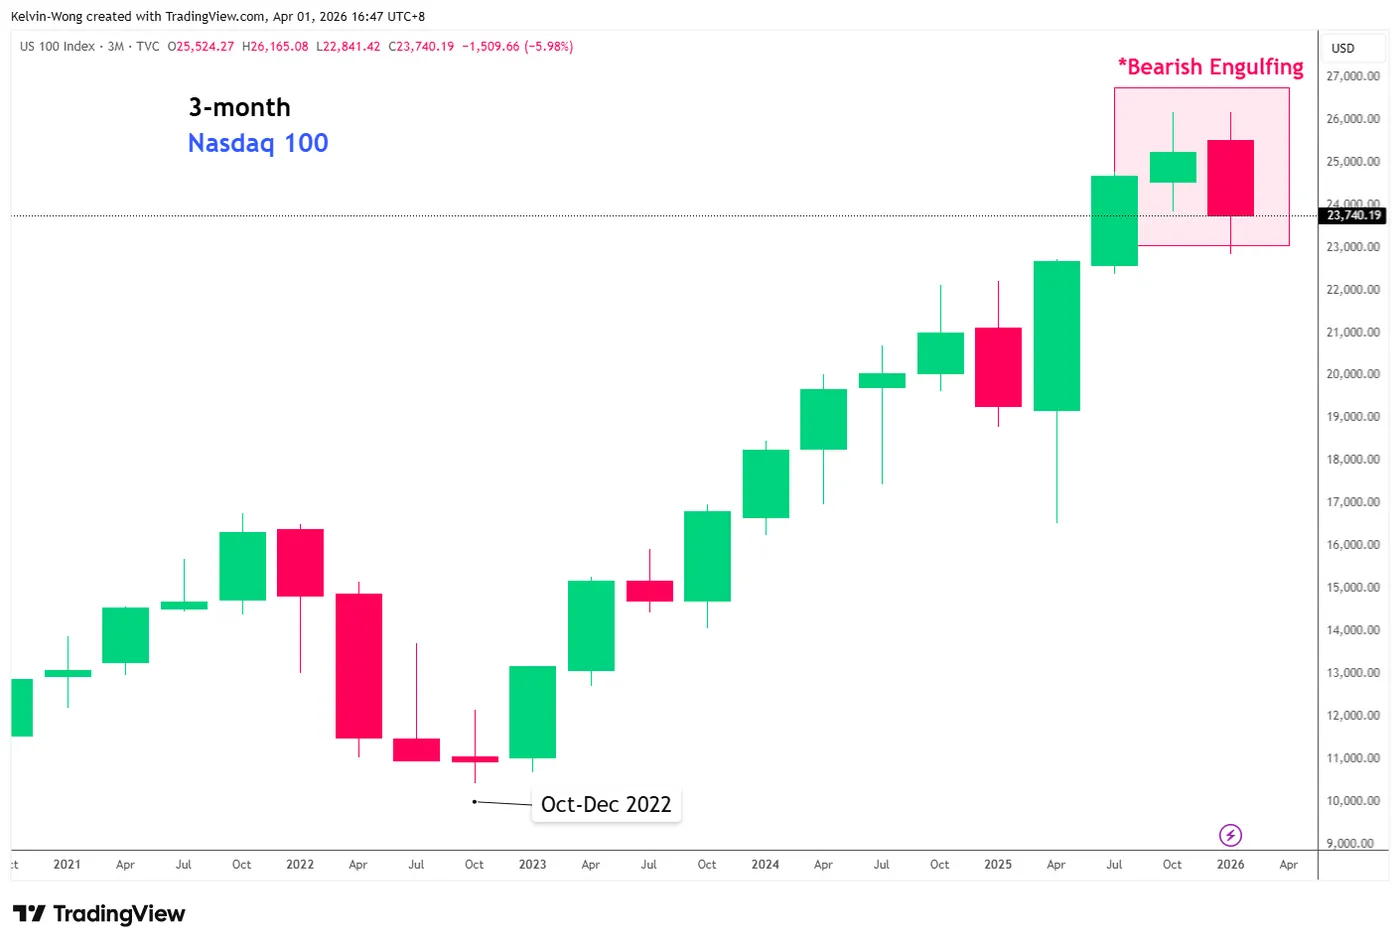
Fig. 2: Nasdaq 100 long-term secular trend as of 31 Mar 2026 (Source: TradingView)
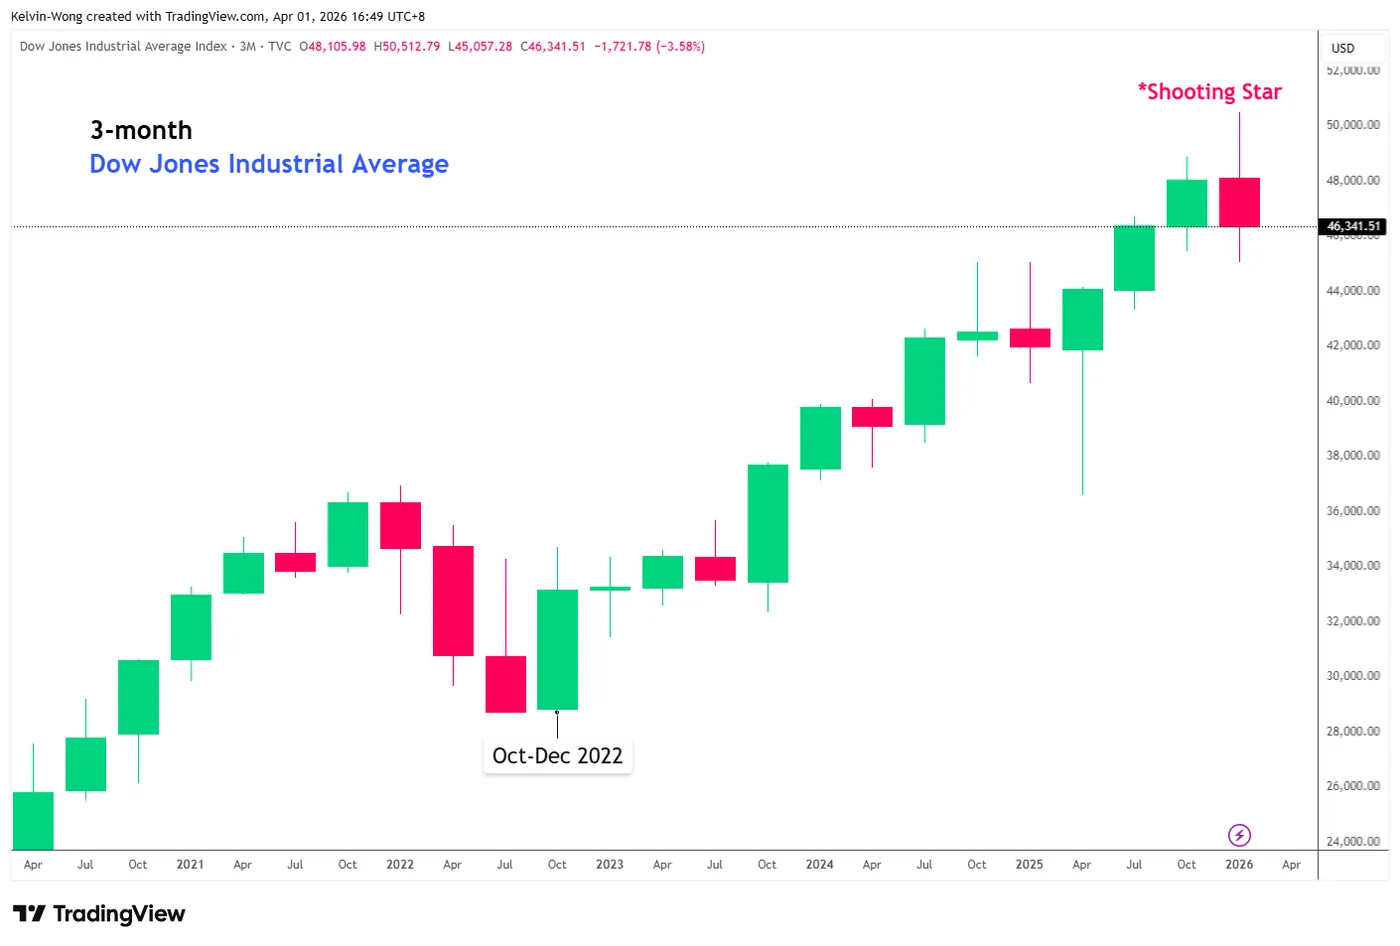
Fig. 3: Dow Jones Industrial Average long-term secular trend as of 31 Mar 2026 (Source: TradingView)
The 3-month charts of the cash stock indices have formed bearish reversal candlestick patterns at the end of Q1 2026.
Both the mega-cap tech-heavy S&P 500 and Nasdaq 100 have flashed “Bearish Engulfing” candlesticks (see Fig. 1 & Fig. 2), while a 3-month bearish “Shooting Star” candlestick was seen on the Dow Jones Industrial Average (DJIA) (see Fig. 3).
Hence, the appearance of such bearish reversal candlestick patterns on the longer-term charts suggests that the bigger macro picture points to a potential deterioration in the longer-term secular bullish trends of the S&P 500, Nasdaq 100, and DJIA rather than the start of a medium-term bullish reversal phase (e.g ex-post US Liberation Day tariffs in early April 2025).
Market breadth remains weak and has not reached capitulation levels
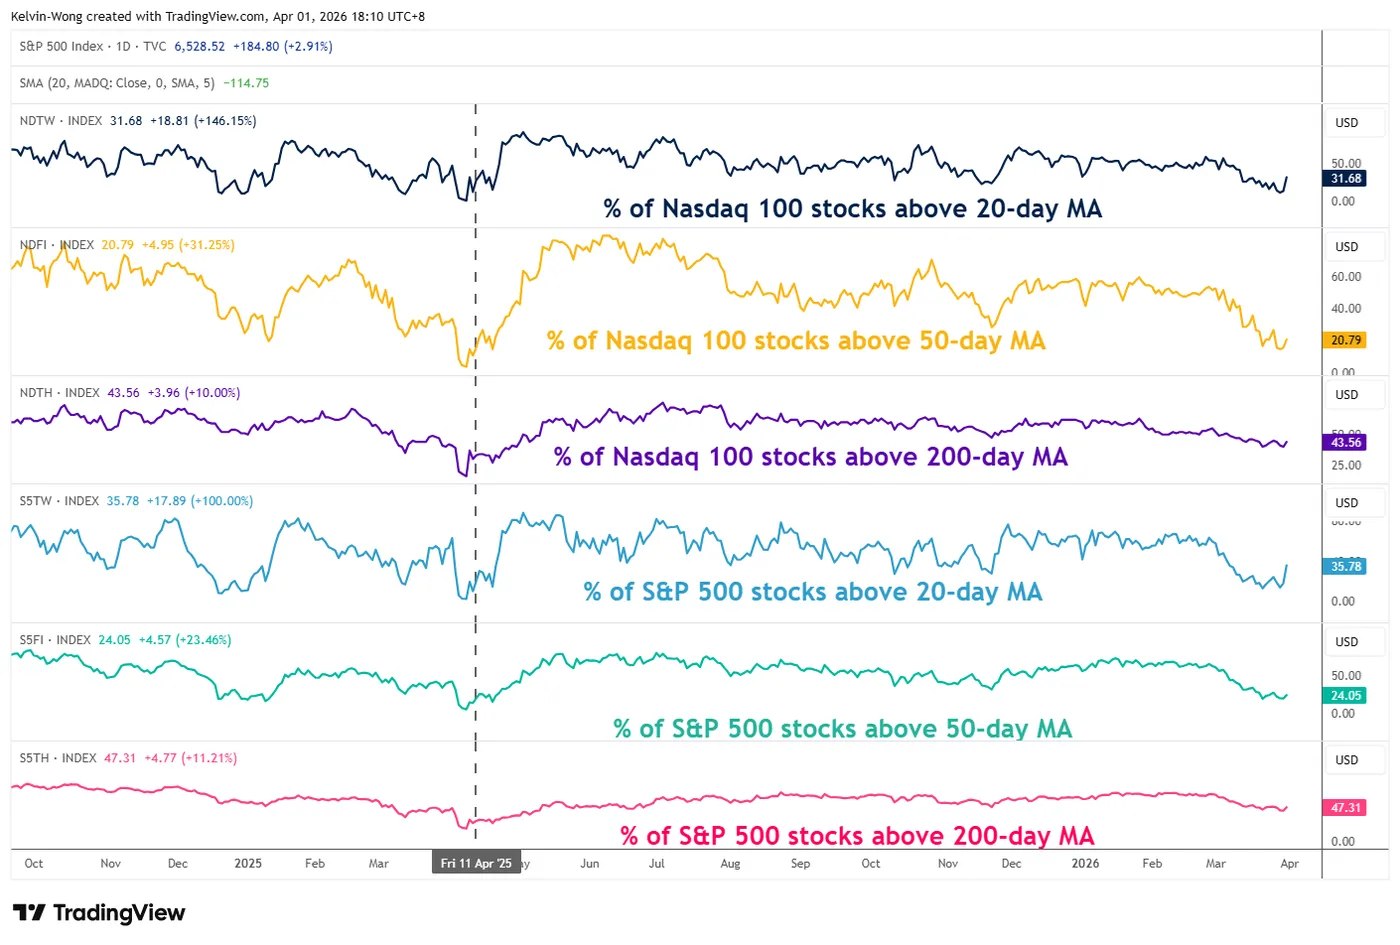
Fig. 4: Percentages of S&P 500 & Nasdaq 100 stocks above 20-day, 50-day & 200-day MAs as of 31 Mar 2026 (Source: TradingView)
The percentage of component stocks for both the S&P 500 and Nasdaq 100 that are trading above their respective 50-day and 200-day moving averages after Tuesday’s rally is still below 50% (see Fig. 4).
The percentage of S&P 500 stocks above 50-day and 200-day moving averages stands at 24% and 47%, respectively. The prior capitulation levels were at 5.2% (above 50-day MA) and 17.7% (above 50-day MA) on 8 April 2025, which led to the ex-post US Liberation Day tariffs’ bullish reversal.
The percentage of Nasdaq 100 stocks above 50-day and 200-day moving averages stands at 21% and 44%, respectively. The prior capitulation levels were at 4% (above 50-day MA) and 16% (above 200-day MA) on 8 April 2025, which led to the ex-post US Liberation Day tariffs’ bullish reversal.
Let’s now decipher the medium-term trends of the S&P 500, Nasdaq 100, and Dow Jones Industrial Average.
S&P 500 – Still below 200-day MA with RSI capped by resistance
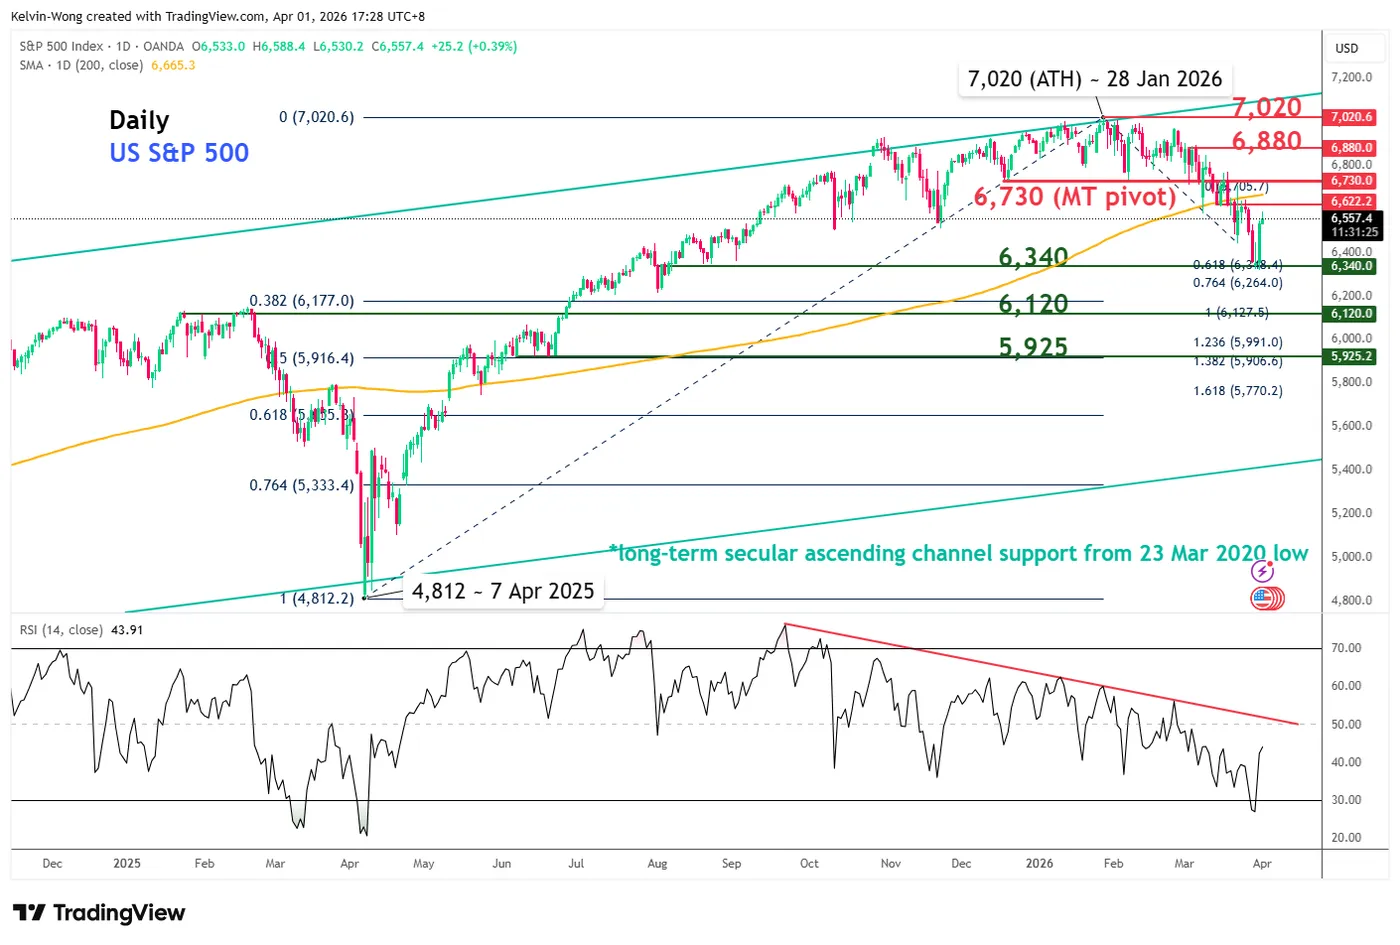
Fig. 5: US S&P 500 CFD index medium-term trend as of 1 Apr 2026 (Source: TradingView)
The medium-term downtrend phase of the US S&P 500 CFD index (a proxy of the S&P 500 E-mini futures) remains intact since its current all-time high of 7,020 printed on 28 January 2026.
Watch the 6,730 key medium-term pivotal resistance, and a break below 6,340 increases the odds of another potential bearish impulsive down move sequence to expose the next medium-term supports at 6,120 and 5,925 (see Fig. 5).
On the other hand, a clearance above 6,730 invalidates the bearish scenario for a squeeze up towards 6,880 and even 7,020.
Nasdaq 100 – Double Top bearish breakdown neckline acting as key resistance
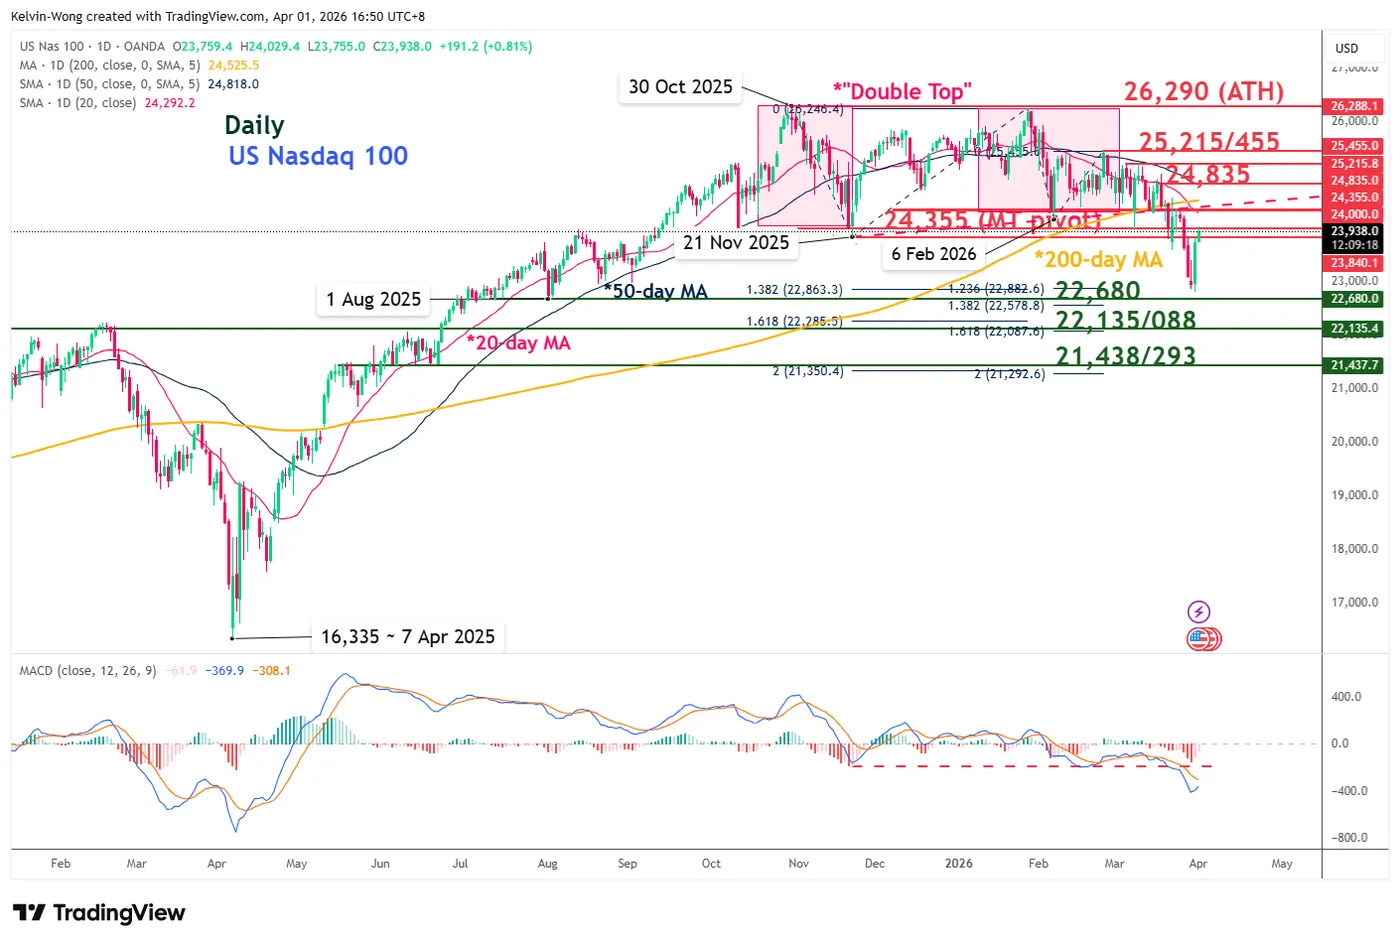
Fig. 6: US Nasdaq 100 CFD index medium-term trend as of 1 Apr 2026 (Source: TradingView)
The current price actions of the US Nasdaq 100 CFD index (a proxy of the Nasdaq 100 E-mini futures) are still trading below the “Double Top” bearish breakdown neckline and 200-day moving average.
The daily MACD trend indicator is still showing no clear signs of a trend change as it continues to hover below the centreline.
Watch the 24,355 key medium-term pivotal resistance, and a break below 22,680 increases the odds of another potential bearish impulsive down move sequence to expose the next medium-term supports at 22,135/22,088 and 21,438/21,293 (see Fig. 6).
On the flip side, a clearance above 24,355 invalidates the bearish scenario for a squeeze up towards 24,835 and 25,215/25,455.
Dow Jones (DJIA) – Resting below the intersection point of the 20-day MA bearish crossover below the 200-day MA
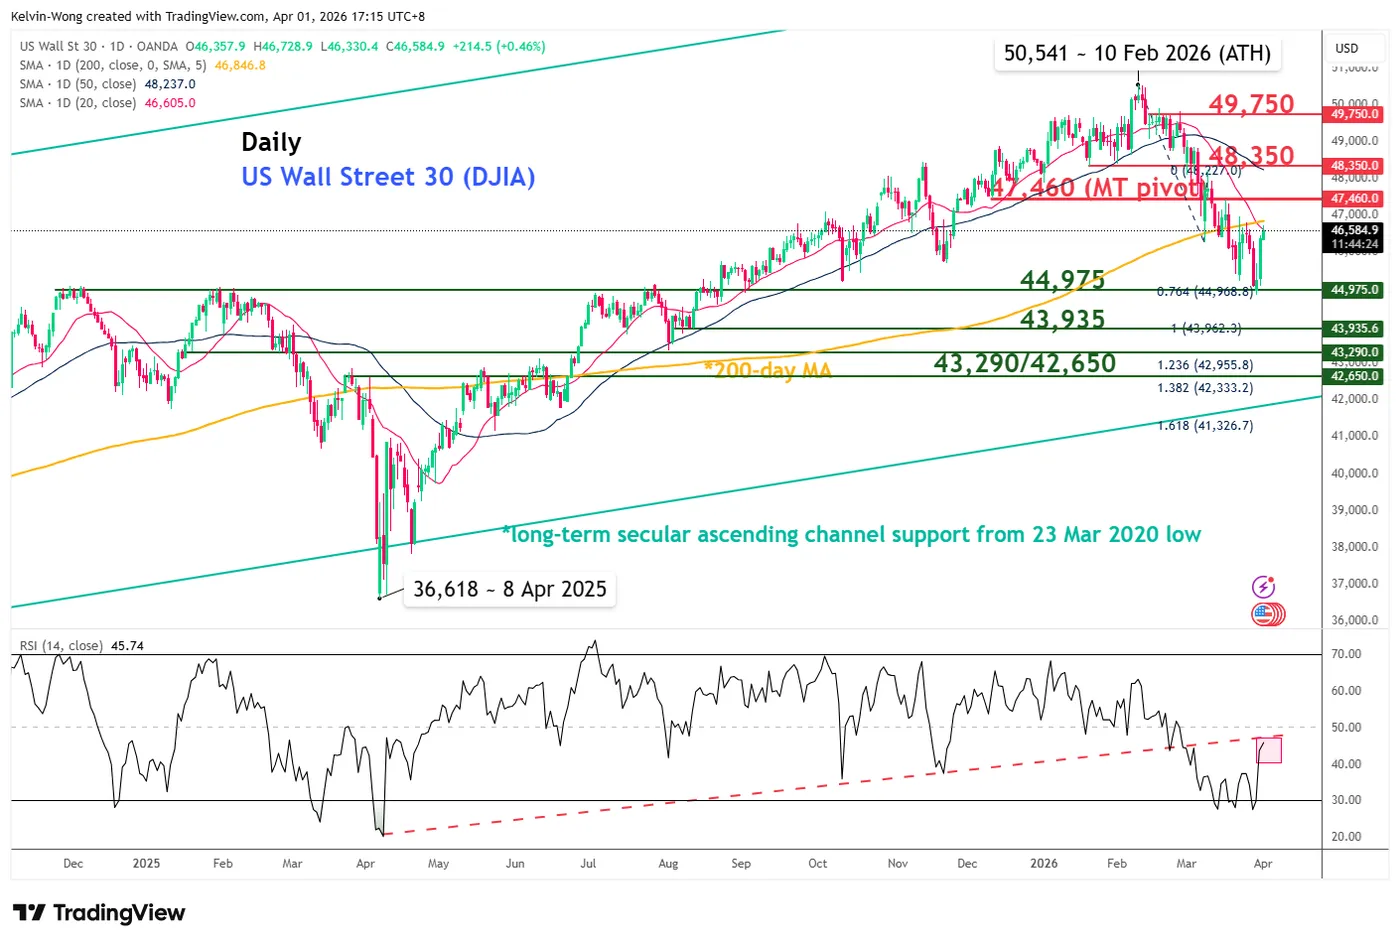
Fig. 7: US Wall Street 30 CFD index medium-term trend as of 1 Apr 2026 (Source: TradingView)
The rallies seen in the US Wall Street 30 CFD index (a proxy of the Dow Jones Industrial Average E-mini futures in the past three sessions have led its price actions to rest just below its 20-day and 200-day moving averages (see Fig. 7).
In addition, the 20-day moving average has flashed out a bearish crossover condition below the key 200-day moving average.
Watch the 47,460 key medium-term pivotal resistance, and a break below 44,975 increases the odds of another potential bearish impulsive down move sequence to expose the next medium-term supports at 43,935 and 43,290/42,935 (see Fig. 6).
On the flip side, a clearance above 47,460 invalidates the bearish scenario for a squeeze up towards 48,350 and 49,750.


