
Stochastic Oscillator
The stochastics indicator is one of the most popular Forex indicators. This classic indicator was developed in the 1950s by a trader named George Lane. Essentially the indicator meaAsures the closing price of an instrument against a range over a specified lookback period and registers momentum as either overbought or oversold.
The indicator, which is a bound oscillator, has two thresholds. The upper threshold, set at 80 indicates price is overbought and the lower threshold set at 20, registers price as oversold. There are two lines moving on the indicator, the K line which is the faster lookback and the D line which is the longer lookback. When the K line crosses above the D-line, it is a bullish signal, and when the K line crosses below the D line, it is a bearish signal.
The indicator can be a fantastic tool for catching key reversal points and is used in many different technical setups. The setup we are going to look at here combines some stochastic reading with some basic chart patterns.
Double Tops
The double top is a classic bearish reversal pattern which essentially highlights the failure of price to break past a key resistance point and a reversal in sentiment.
The pattern essentially forms an “M” and can either have a deep reaction low between the two tops or a shallow reaction low.
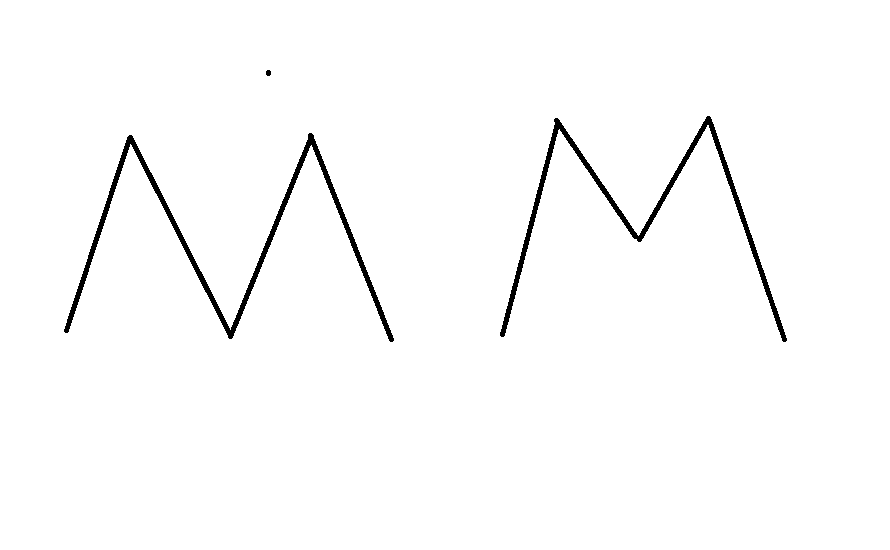
Price trades up to make an initial high before selling kicks in and price reverses lower. Buyers then step back in and drive the price back up to test the initial high, however, once again selling kicks in and this time drives price meaningfully lower.
This pattern is found at a lot of key bearish reversal points at either a change in trend or at the exhaustion point within a correction.
The stochastic indicator can make a fantastic filter for trading this pattern. Essentially, the dynamic we want to see is price retesting the resistance level, to create the double top, with stochastics displaying bearish divergence.
A bearish divergence is where price is testing a former high or making a new high, but the stochastics indicator is putting in a lower high. This indicates to us that bullish momentum has weakened and suggests that price is likely to reverse from the level instead of breaking out above it.
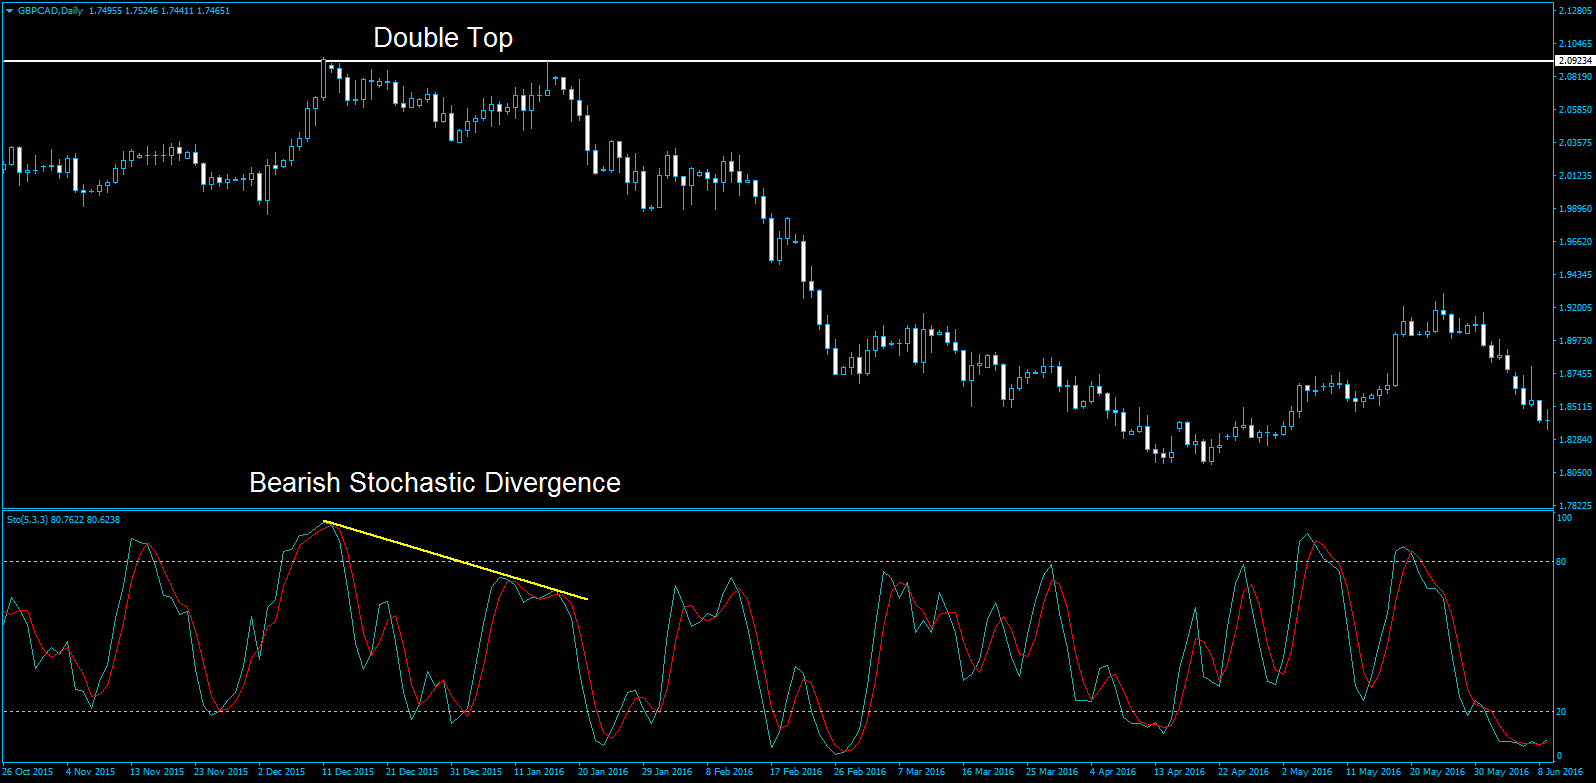
In the above chart, we have a fantastic example of this setup. Price has traded up to test a previous high, giving us our double top formation yet as you can see, the stochastics indicator has put in a much lower high indicating a dramatic weakening of bullish momentum and from that point price reverses lower.
There are a few ways you can trade this setup.
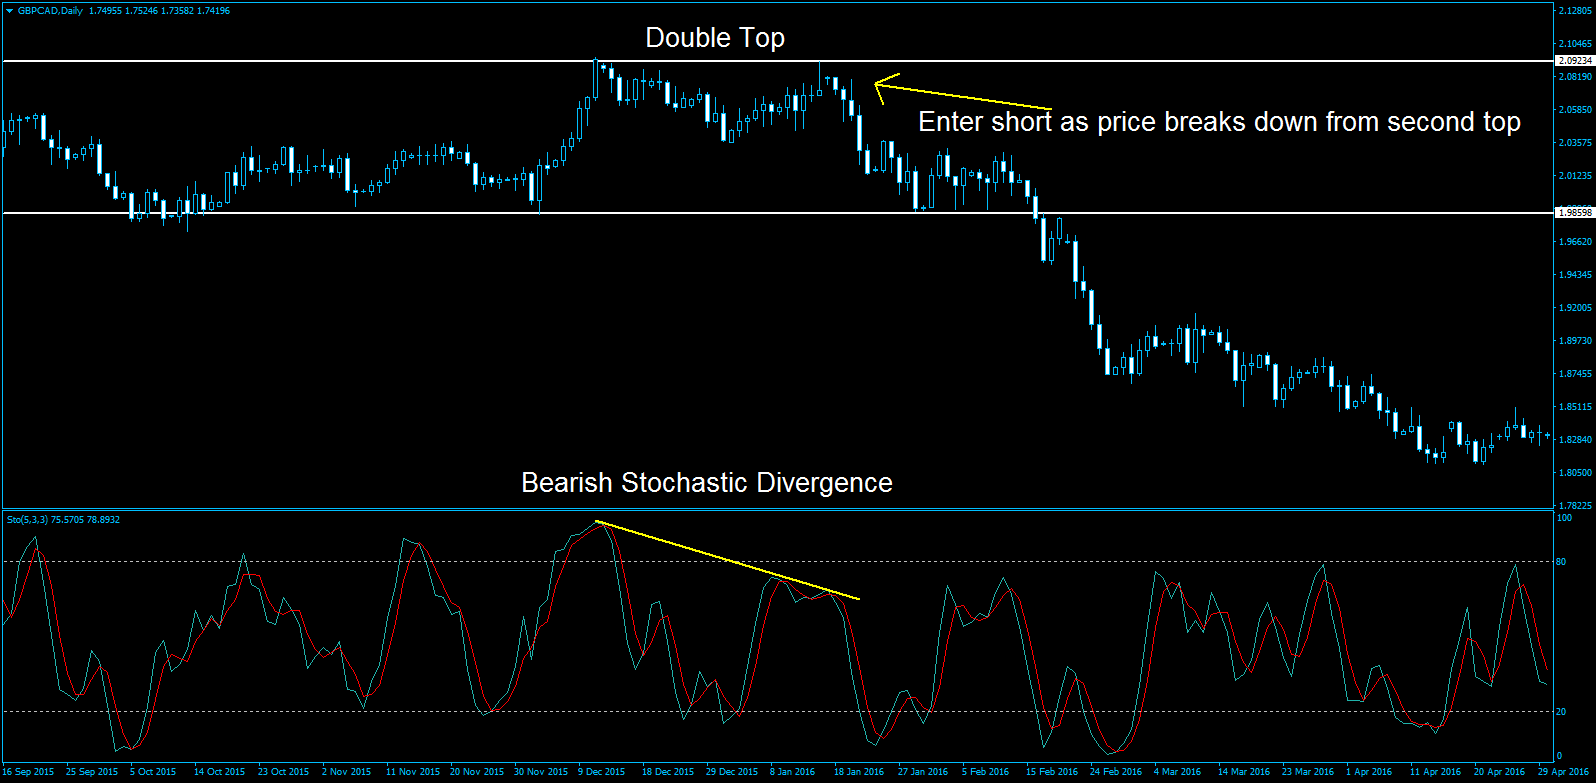
The first is simply looking to short price as it breaks down from the second top as a reversal play.
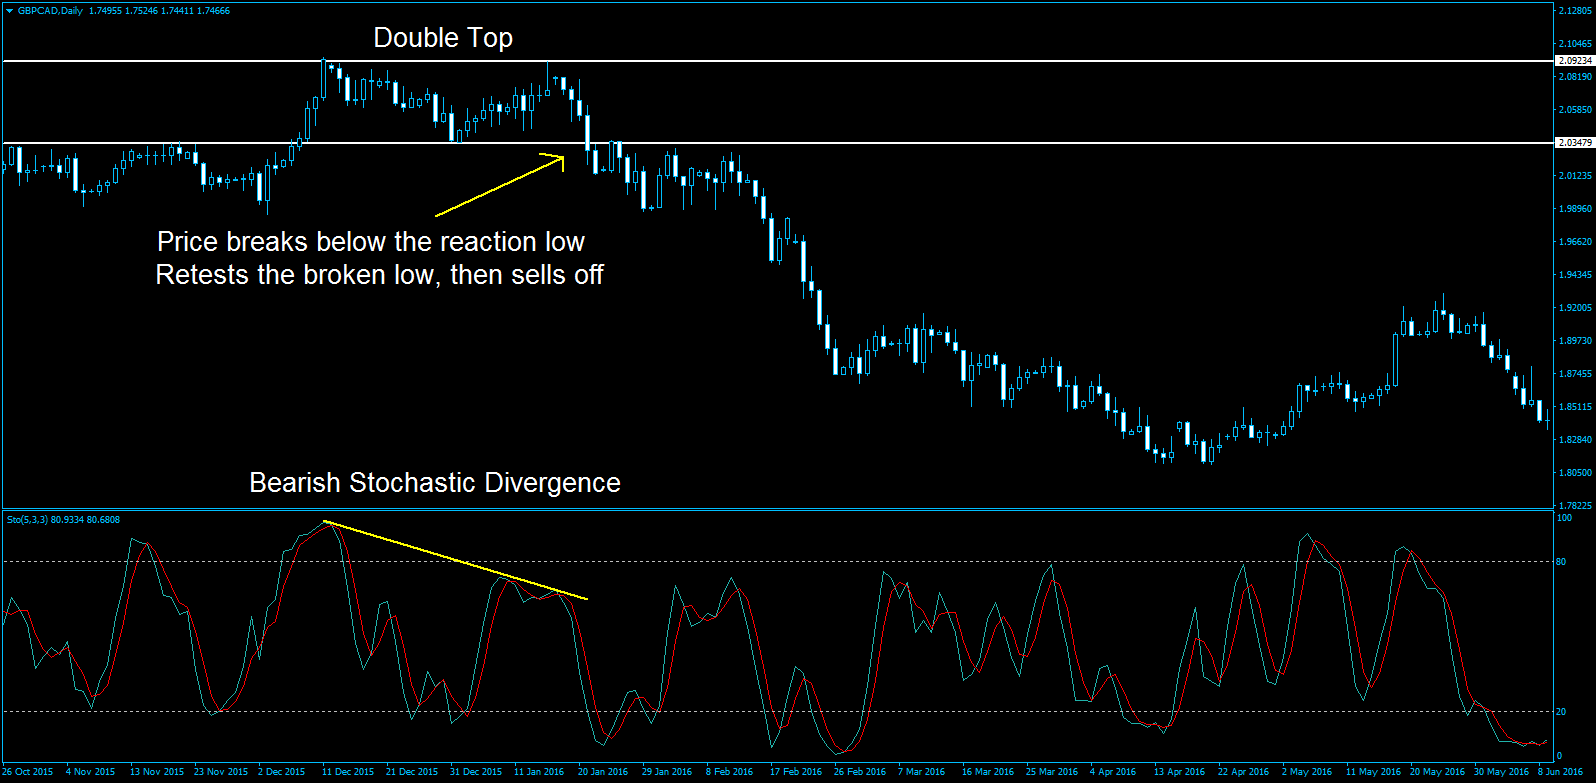
The second is looking to trade price as it breaks down through the reaction low put in between the first and second top. This is a breakout play.
The third is looking is to trade price as/if it retests the broken reaction low.
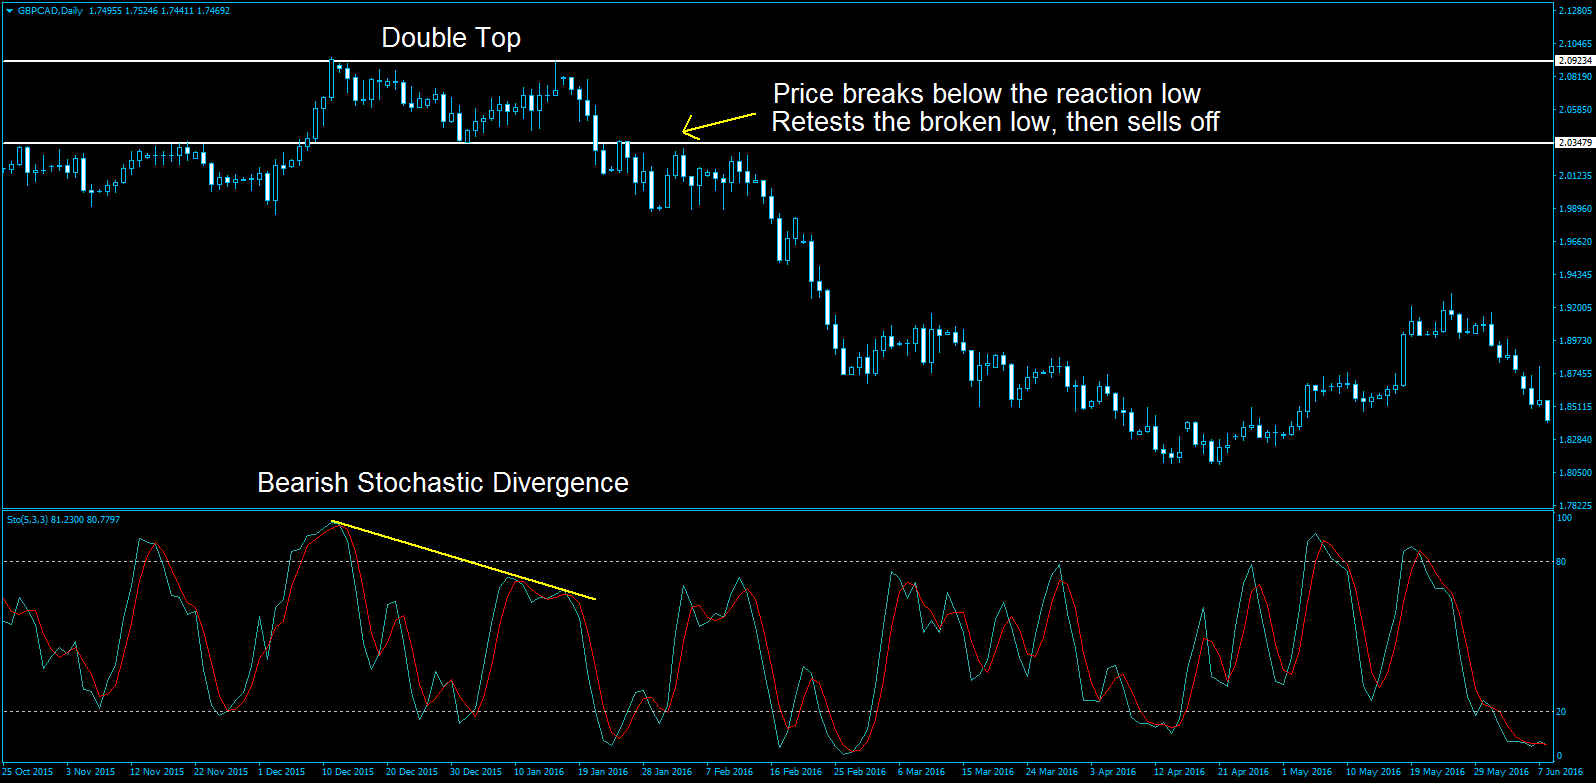
Finally, you can look to trade price as it breaks down through the low of the structure, what we call the neckline of the pattern. Again, you can also look to trade a retest of the broken low if it happens.
Double Bottoms
The setup also works in reverse with double bottoms which form a “W” shape.
This time, we are looking for price to test a prior support level with bullish stochastic divergence suggesting that a reversal is likely to occur.
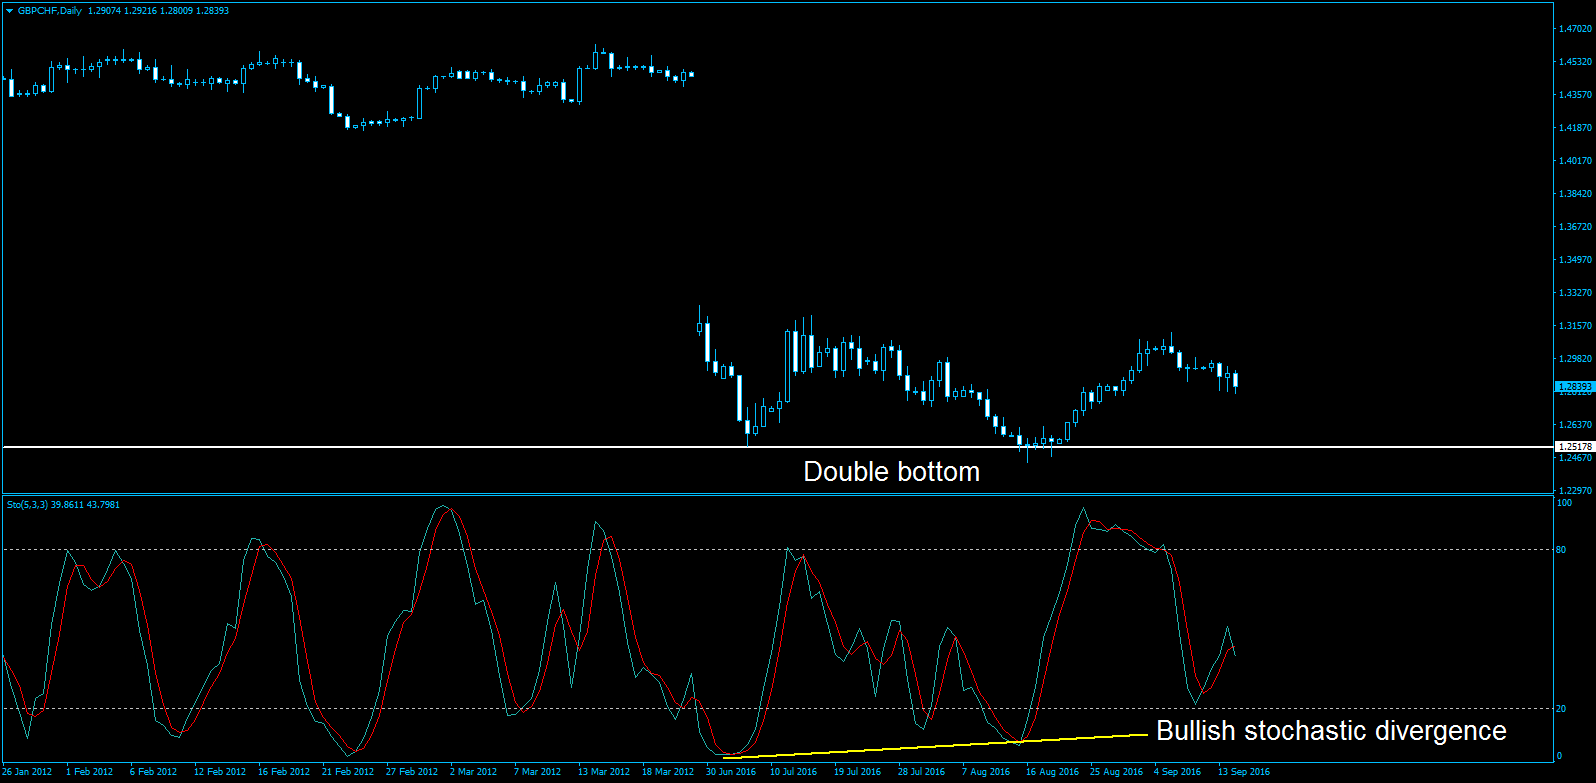
In the above example, the price has come back down to challenge a prior support low and even pierces slightly below the initial low, however, the stochastics indicator signals that the move is lacking bearish momentum as the indicator has put in a higher low.
This is a classic technical setup and demonstrates how you can combine some simple chart pattern reading with some indicator reference to identify opportunities in the market. The use of a dual filter approach is a more conservative way to trade as we need the presence of both the chart pattern and the indicator reading to give us entry to the market.


