
The market spent the last week behaving as though a US-Iran deal was only a matter of time. That assumption just took a major hit. Instead of accepting Washington’s 14-point peace framework, Tehran pushed back with its own proposal: lift sanctions, ease the blockade around Hormuz, and negotiate nuclear restrictions over the next 12 to 15 years. Trump’s answer came quickly and bluntly on Truth Social: “TOTALLY UNACCEPTABLE.”
That rejection undermines the entire market thesis that geopolitical tensions were gradually moving toward controlled de-escalation. Investors had increasingly convinced themselves that even if fighting continued, the conflict would stay economically contained. That belief helped fuel relentless buying in AI stocks, record highs in NASDAQ, and persistent Dollar weakness despite ongoing military clashes around the Gulf.
Oil never fully bought into that optimism. Brent held stubbornly elevated even while equities celebrated the “peace trade.” Today’s sharp rebound toward $105 suggests energy markets are still pricing in a different reality — not peace, not full war, but a drawn-out confrontation where shipping risks, military threats, sanctions pressure, and nuclear brinkmanship become semi-permanent features of the global economy.
The emerging reality looks messy. Iran appears to be trying to institutionalize leverage through Hormuz while buying time on nuclear concessions. Meanwhile, Israeli Prime Minister Benjamin Netanyahu openly says the war is “not over,” insisting enriched uranium still has to be physically removed from Iran. Trump himself continues threatening much harder military action if Tehran refuses to comply. That creates a far more dangerous macro backdrop because prolonged instability can be worse for inflation than a short shock.
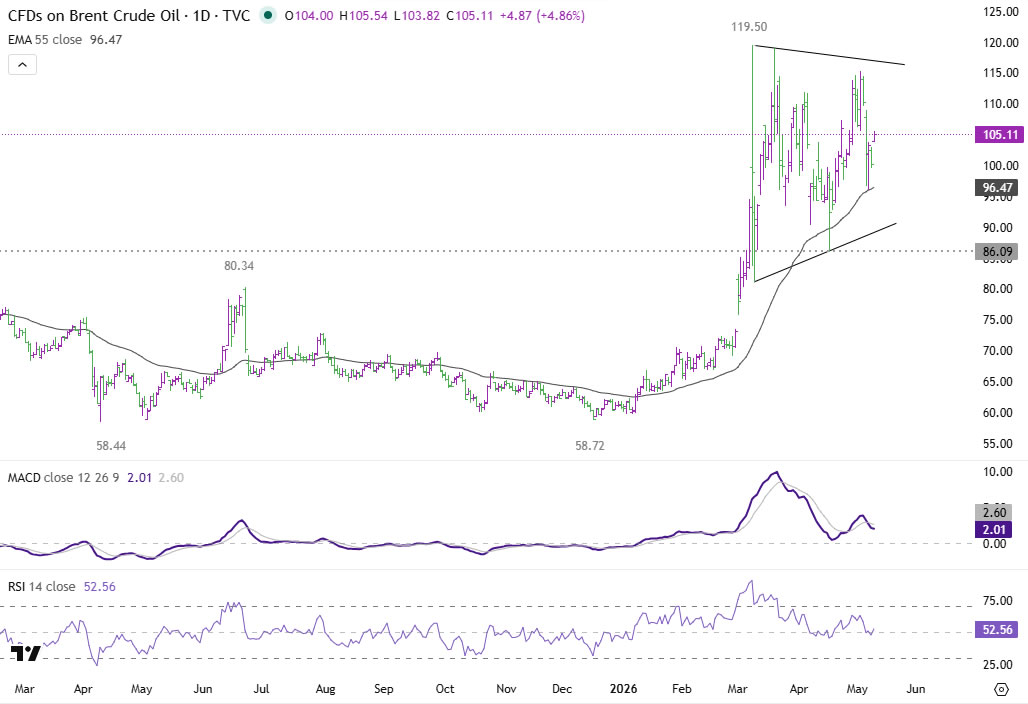
The technical picture in Brent crude is also becoming increasingly unsettling. Since topping at 119.50 in March, prices have compressed into what appears to be a symmetrical triangle — one of the market’s classic “stored energy” patterns. Every ceasefire rumor has pulled prices lower. Every diplomatic failure has pulled them back higher. But the overall range keeps tightening.
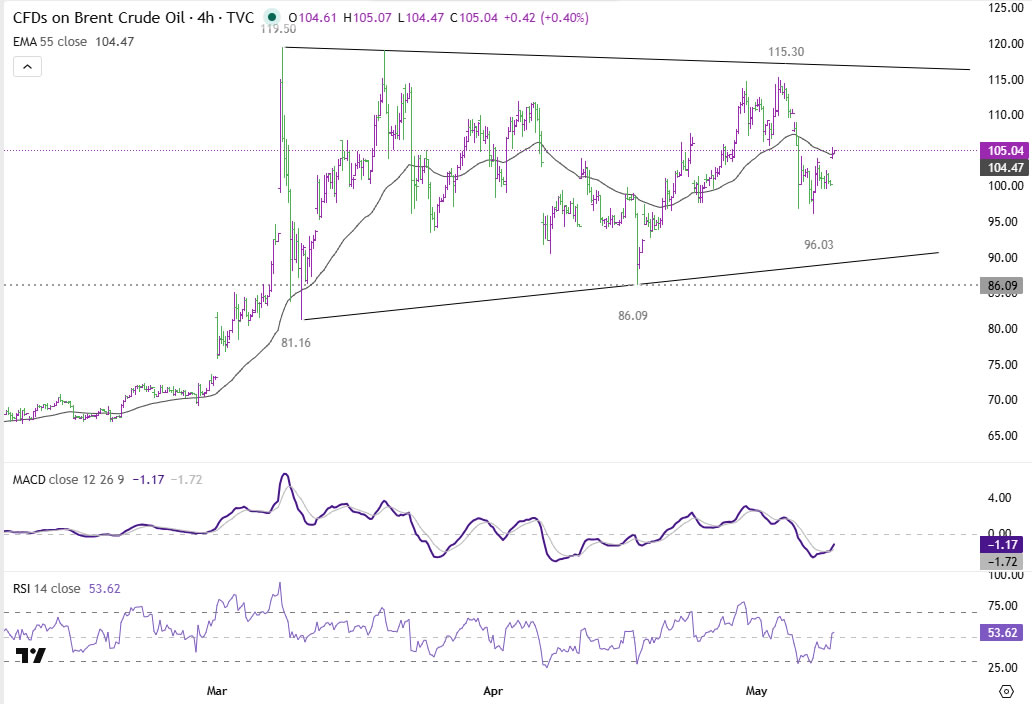
Technically, that type of compression rarely lasts forever. The tighter the triangle becomes, the more violent the eventual breakout tends to be. Brent now appears to be starting another rising leg toward 115.30 resistance zone, and if the upper boundary eventually gives way, the measured move projects toward the 135–140 area. That is the real risk oil markets may now be warning about.


