
On 30 June, Prime Minister Keir Starmer unveiled the Defence Investment Plan, which includes a £15 billion increase in defence spending as part of a nearly £300 billion four-year budget. The market reacted quickly: on 1 July, shares of Babcock, BAE Systems and Rolls-Royce gained between 1.1% and 5.2%, providing support for the FTSE 100 during the session. Offsetting this strength, healthcare and energy stocks came under pressure, with AstraZeneca and GSK falling 1.7% and 2.5%, while Shell and BP lost more than 2% as oil prices declined. As a result, the index closed the day 0.2% lower. Over a longer-term horizon, investors remain focused on the Bank of England’s meeting on 30 July. The central bank has kept the base rate at 3.75%, while inflation risks remain elevated amid energy price dynamics and geopolitical tensions in the Middle East.
Technical Outlook
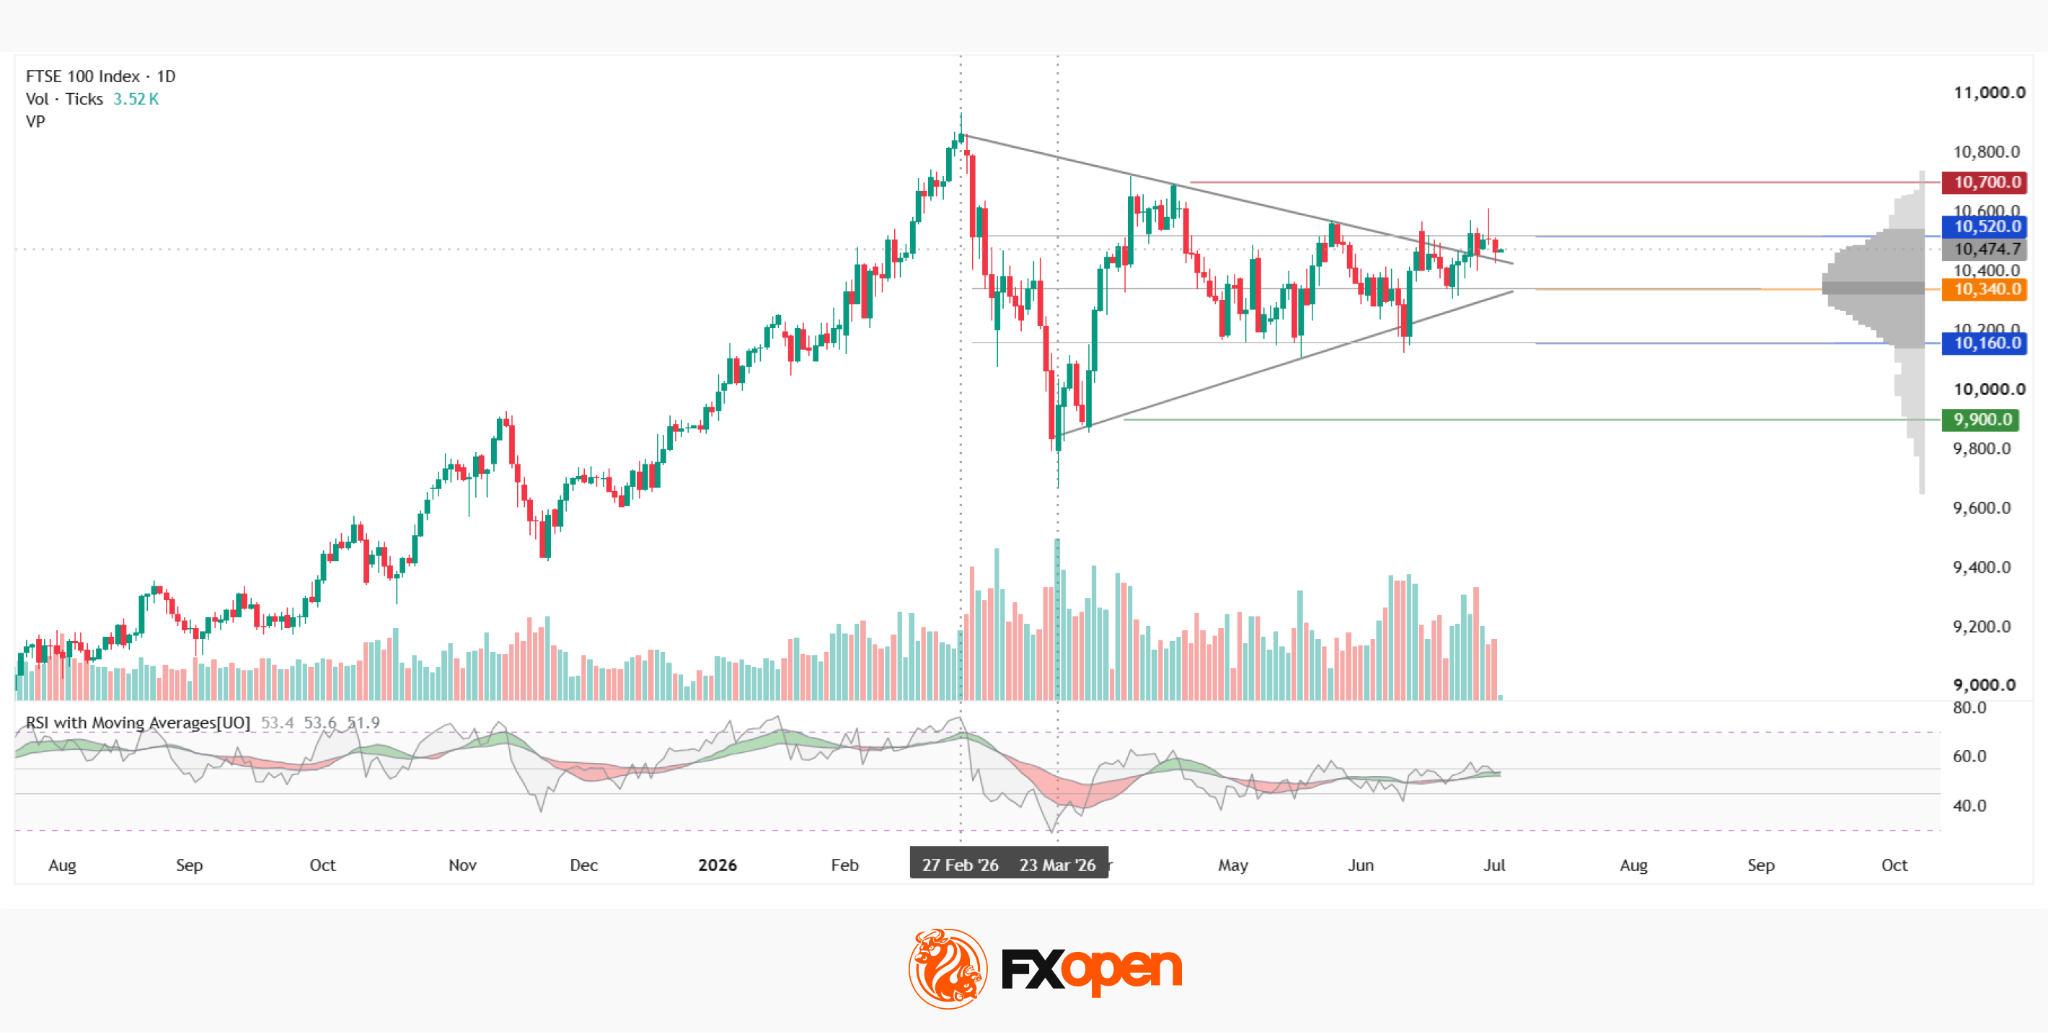
On the daily chart, the FTSE 100 (UK100 on FXOpen) has formed a symmetrical triangle, with price fluctuations narrowing between the February high and the March low. In recent sessions, the index has attempted to break above the pattern, but the move has so far been capped by the upper boundary of the current market profile at 10,520, making it too early to confirm a breakout. The key resistance level is located around 10,700, while major support lies near 9,900.
Should the index decline from current levels, the nearest support could come from the POC zone at 10,340 and the lower boundary of the market profile at 10,160. It is worth noting that trading volume remains firm, suggesting the current range may continue to develop. The RSI + MAs indicator currently reads 53, 53 and 51. All three values remain in neutral territory, confirming the current lack of directional conviction.
Summary
The narrowing price range within the symmetrical triangle points to declining volatility in the index amid a mixed fundamental backdrop. Geopolitical uncertainty surrounding US-Iran negotiations is coinciding with expectations ahead of the Bank of England’s upcoming meeting. The POC zone remains a key reference point within the current market structure.
Trade global index CFDs with zero commission and tight spreads (additional fees may apply). Open your FXOpen account now or learn more about trading index CFDs with FXOpen.
This article represents the opinion of the Companies operating under the FXOpen brand only. It is not to be construed as an offer, solicitation, or recommendation with respect to products and services provided by the Companies operating under the FXOpen brand, nor is it to be considered financial advice.


