
Silver (XAGUSD) continues to exhibit an incomplete sequence from the January 29, 2026 high, suggesting that further downside remains possible. In the short term, the cycle from the May 14, 2026 high is unfolding as a double three Elliott Wave structure. From that peak, wave (W) concluded at 61.46, while the corrective rally in wave (X) terminated at 71.6. The market has since resumed lower in wave (Y), which is internally subdividing into another double three of lesser degree. This development underscores the persistence of bearish momentum within the broader corrective framework.
From wave (X), the initial wave W ended at 55.57. The subsequent rally in wave X is now advancing as a corrective move, designed to retrace the cycle from the June 18, 2026 high before the metal resumes its downward trajectory. As long as the pivot at 71.6 remains intact, rallies are expected to fail in either three or seven swings, reinforcing the case for continued weakness.
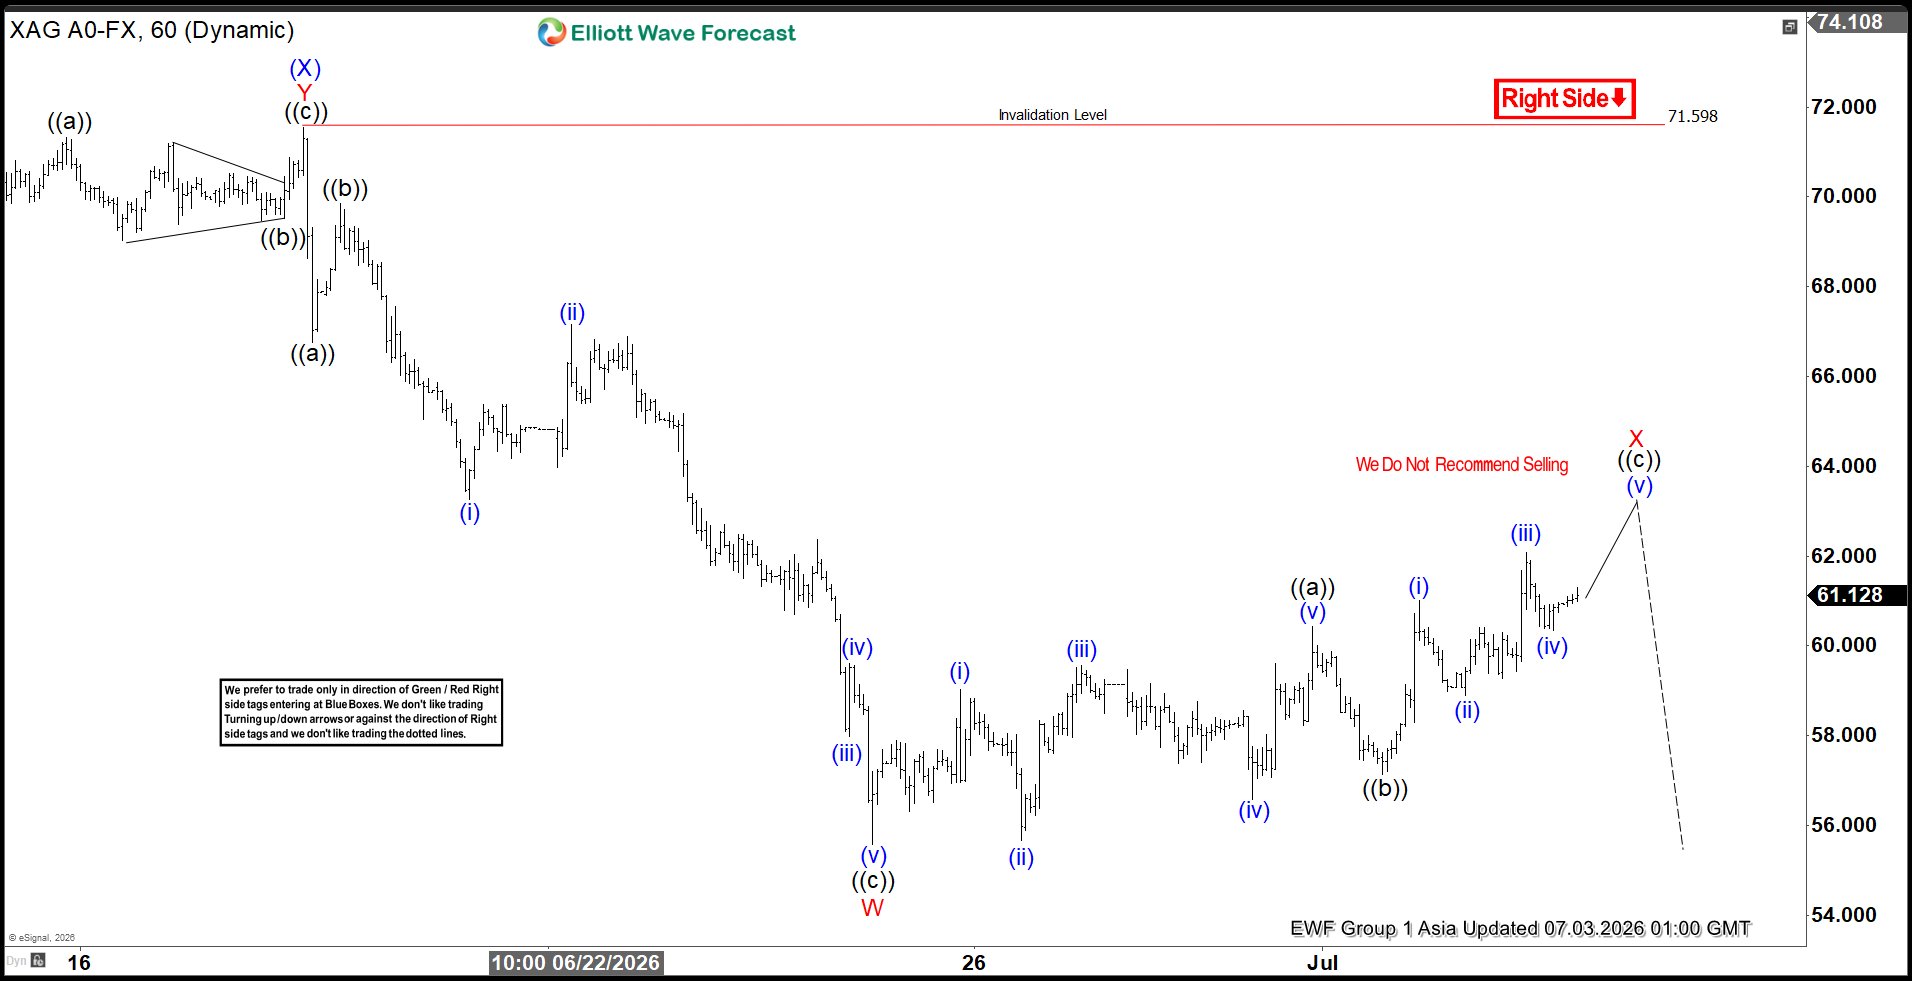
Resistance is projected within the 62–65 zone, defined by the 100% to 161.8% Fibonacci extension of wave ((a)). This area represents a critical inflection point where corrective strength may exhaust, paving the way for renewed selling pressure. Traders should monitor this region closely, as rejection from resistance would confirm the continuation of the larger bearish cycle.
Silver (XAGUSD) 60-Minute Elliott Wave Chart
XAGUSD Elliott Wave Video:
You are currently viewing a placeholder content from Default. To access the actual content, click the button below. Please note that doing so will share data with third-party providers.


 continues to exhibit an incomplete sequence from the January 29, 2026 high, suggesting that further downside remains possible. In the...)