


Key Highlights
- Bitcoin failed to surpass $65,650 and started a fresh decline.
- A key bearish trend line is forming with resistance at $64,500 on the 4-hour chart of BTC/USD.
- Ethereum also struggled above $1,920 and dipped from resistance.
- The Fed interest rate decision is scheduled, and the market forecast is no change from 3.75%.
Bitcoin Price Technical Analysis
Bitcoin price attempted to gain pace for a move above $65,500 against the US Dollar but failed. BTC trimmed most gains and signaled a downside break.
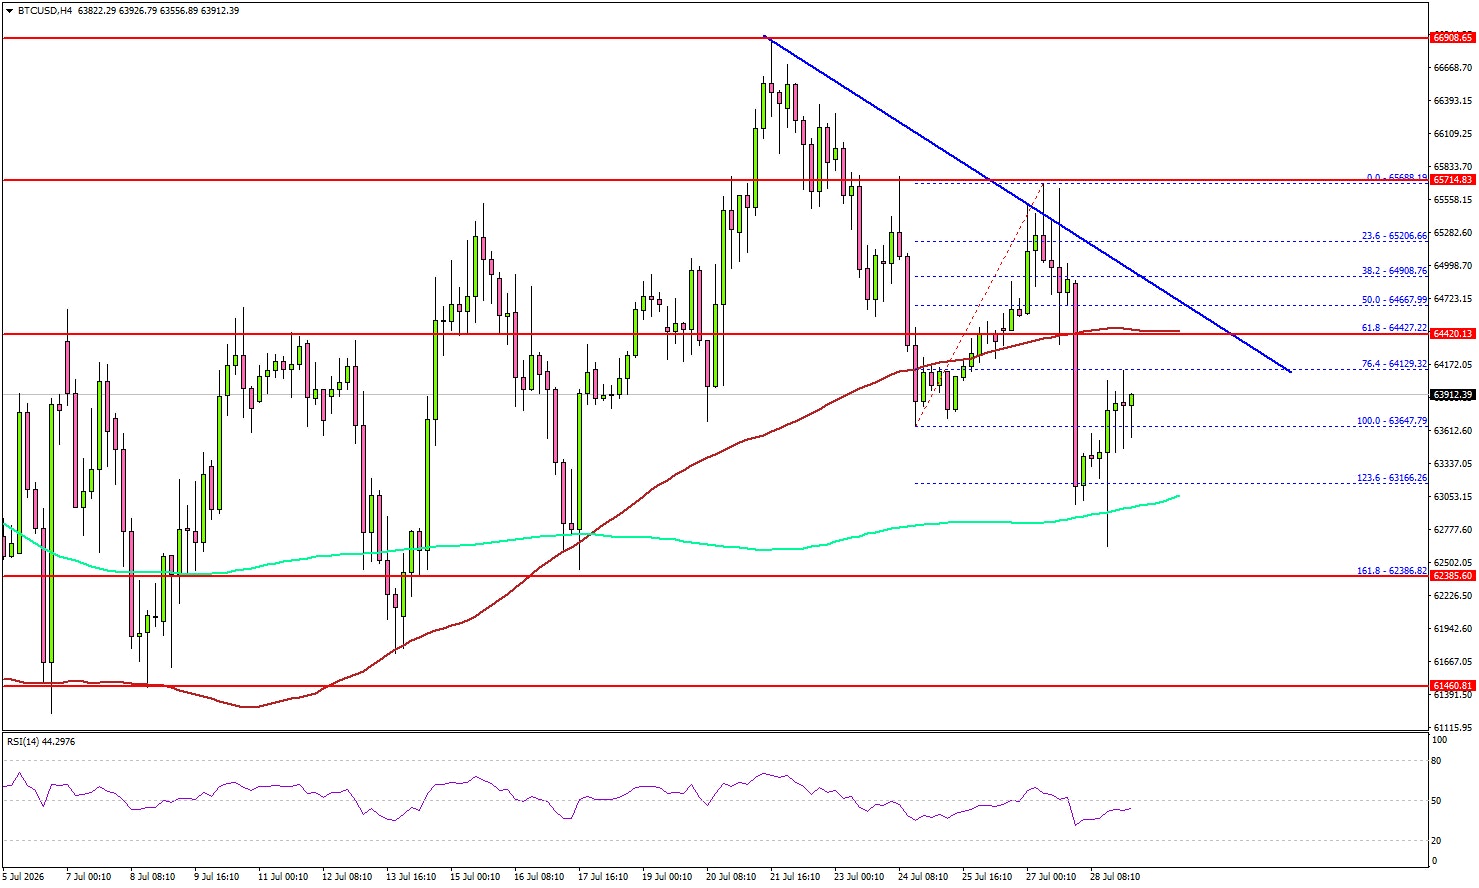
Looking at the 4-hour chart, the price formed a high near $65,688 and started a fresh decline. There was a move below $65,000 and $64,200. The price traded below the 76.4% Fib retracement level of the upward move from the $63,647 swing low to the $65,688 high.
More importantly, BTC settled below the 100 simple moving average (red, 4-hour) and tested the 200 simple moving average (green, 4-hour). If the bears remain in action, the price might find bids near the 1.236 Fib extension level at $62,385.
A downside break and close below $62,385 could trigger a sharp decline. In the stated scenario, the price could test $61,200 or even $60,500.
On the upside, an immediate resistance could be $64,200. The first major resistance might be $64,500 and a bearish trend line. The main resistance might be $65,650. A close above $65,650 could send the price toward $66,800. Any more gain might call for a test of $68,000.
Looking at Ethereum, the price trimmed some gains, and the bears might now aim for a drop below $1,820.
Today’s Key Economic Releases
- Fed Interest Rate Decision – Forecast 3.75%, versus 3.75% previous.
- Fed Monetary Policy Statement.
- FOMC Press Conference.





