
What is Breakout Trading?
Breakout trading is simply where we look to capture an expansion in price as it moves beyond either a defined high point or a defined low point. This is the basis of breakout trading and as you will see, is extremely simple. So typically, traders will identify a trading range such as this one where prices are rotating between a high point and a low point and then will simply look to enter a trade as price breaks either above the high or below the low.
Now, one of the key elements to successful breakout trading is in how you identify the range. Correctly identifying the range will put you at an advantage. Some of the classic ways to identify ranges are based on identifying highs and lows over certain periods. Such as the daily high and low over the last 20 days. The last 20 trading days is roughly a month. Or alternatively, if you’re trading on the lower timeframes, identifying the highs and lows over the last trading day.
However, when you identify ranges, the key point is that you need to properly identify the support and resistance that frame the range. So, lets go a bit deeper.
Breakout with Trend
One of the first ways that we can improve the traditional breakout method is to look to trade with the trend only. So, essentially, when trading with this method, we look to identify an impulsive move in price followed by a consolidation, which forms a small range. We then look to play a breakout of the range in continuation of the trend. Trading in this manner keeps momentum on our side and gives us a far stronger chance of catching a proper move.
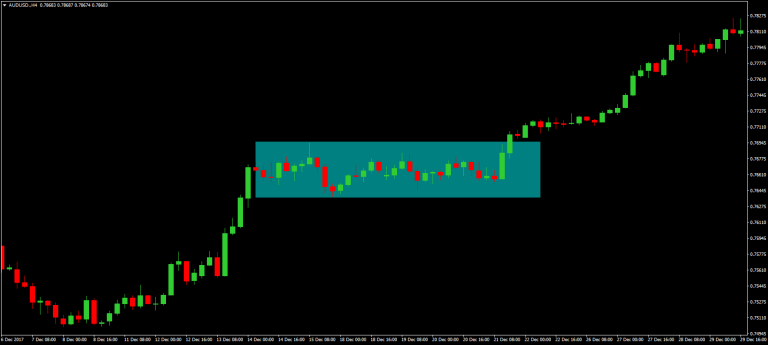
So, in this example you can see that price makes an explosive move higher before momentum stalls and we form a small block of consolidation giving us a brief range framed by these highs and these lows. So, knowing that the trend is bullish, we anticipate that price is going to break to the topside, so we set an order to buy above the high of the range. We then set our stop on the other side of the range (if this was a bearish trend we would have an order to sell below the low of the range with our stop above it) and our target is then a minimum of 2 x our stop, so, 2 x the width of the range.
Waiting For The Candle Close
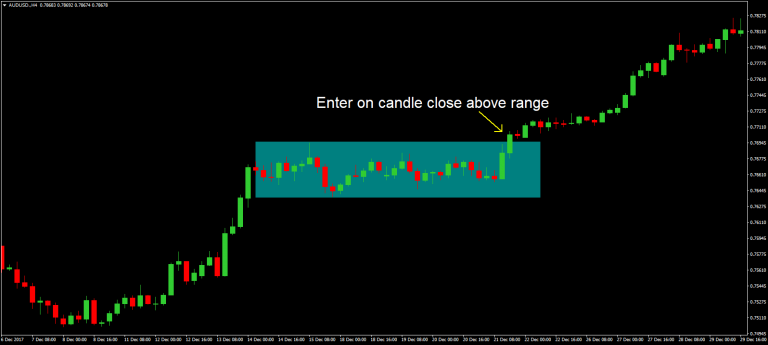
Now, one really important point to highlight here is how we actually enter a breakout. Many traders will enter a breakout trade as soon as price breaches the boundaries of the range, before the candle has closed. However, this is an extremely risky strategy because entering in this manner exposes you to the risk of catching a false breakout where price breaches the range before reversing back inside. To add more weight to our bias, we will only enter breakout trades on a candle close beyond the range boundary. So, in this instance where we are trading long, we need to see a candle close above the high of the range and vice versa for bearish trends. We would need to see a candle close below the low of the range to set a short trade.
Using Indicators
We can also use certain indicators to help us identify range situations and breakouts. One of the best indicators for this is the Bollinger band indicator. Hopefully you can remember Bollinger Bands from the session we did on it – if not make sure to take some time to go back over that one! – But basically, Bollinger bands are great for giving us a guide to the trend direction in the market as well as the volatility. The middle band is a 20 period moving average and the upper and lower bands mark 2 std deviations above the average and 2 std deviations below the average respectively. Now many people look to trade Bollinger bands simply by trading a breakout as price breaks through either the upper or lower Bollinger bands, however, this tends to be an ineffective way to trade them because price so often breaks the Bollinger bands only to reverse back inside them.
Instead, what we have to do is combine Bollinger bands with our understanding of support and resistance. This will give us a much better chance of catching a proper move. So essentially with this method we are looking to identify a range in price where the market is rotating between a high and low point. This will be clearly identified by the Bollinger bands which will be moving in rather a flat fashion, with price bouncing off the upper and lower bands. What we then want to identify is price breaching either the high or low of the range as well as breaking out of the Bollinger bands, to signal a shift in momentum.
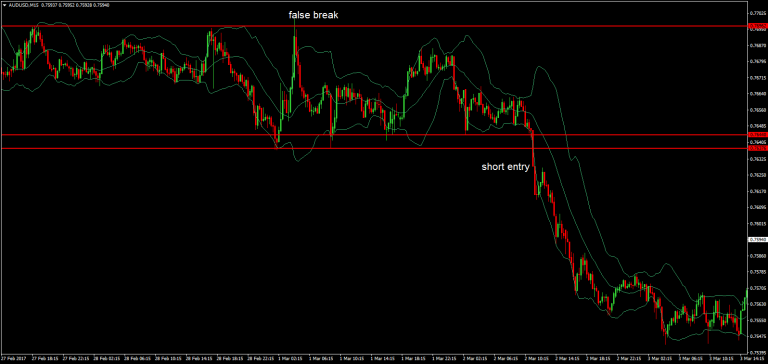
So, looking at this example you can see that price is framed clearly in a range between these high points here and these low points. Price is also clearly respecting the Bollinger bands, bouncing off the upper and lower bands. You can also see that instead of moving higher or lower, the Bollinger bands are simply moving in a sideways fashion – indicating the lack of momentum in the market.
However, at this point here we can note two things. One, price has broken down beneath the low of the range and secondly, price has broken out below the lower Bollinger bands. The confluence of these two elements confirms the bearish breakout and we would go ahead and sell on the close of the candle that closes here beneath both the range low and the Bollinger band low.
We mentioned earlier the importance of waiting for a candle close beyond the range boundary to avoid false breakouts. You can see clearly here an example of why this is such an important aspect of breakout trading because in this instance price shoots up breaking above the high of the range only to reverse sharply back inside and sell off down to the range low. If we had entered on the break of the high we would have been stopped out, whereas waiting for candle close keeps us out of trouble.
Dynamic Ranges
So far we have looked at how you can trade breakouts of static ranges, e.g ranges defined by a horizontal high and low. However, you can also trade breakouts of dynamic ranges. E.g ranges that are defined by a structure such as a channel. We previously covered trend lines in an earlier session, but you can refresh your memory at the next session. So, channels are essentially structures that form when price moves between two identical trend lines that form support and resistance. To identify a channel, we simply first establish a trend line and then clone it to apply it to the other side of price.
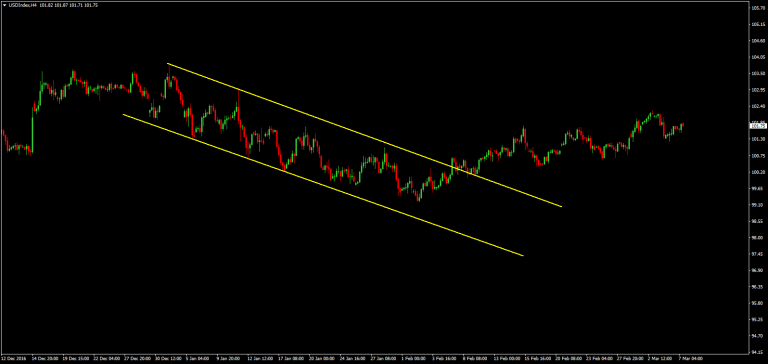
So, in this example you can see that we have a clear bearish trend line formed from joining this high point with this lower high. We can then take that trend line and apply it to the underside of price and you can see that it perfectly captured the swing lows. So, we have a clear bearish channel in play here with price trending lower rotating between the upper and lower trend lines. As we see a channel like this developing we can be on the lookout for the opportunity to trade a reversal as price breaks out of the channel as it did here. You can see that after holding the channel for over a month price eventually broke out of the topside of the channel and traded higher.
Channel breaks can be a fantastic way to catch reversals in trends and the way that we enter trades on channel breaks is the same as how we enter breaks of typical ranges. We wait for a candle close outside of the range, so in this instance you can see that price broke out of the range here with this large bullish candle and closed above the bearish channel resistance line giving us our long entry.
Now, when it comes to trading channel breaks one of the ways that we can increase our chances of success to use indicators to highlight potential reversals. Using an indicator such as RSI can help us spot when momentum is waning in the channel and the market is vulnerable to a reversal. So, looking at this example again with the RSI indicator on this time we can see clear bullish divergence.
You should be really familiar with this term by now but, just to make sure, divergence is when moves in prices aren’t supported by the indicator.
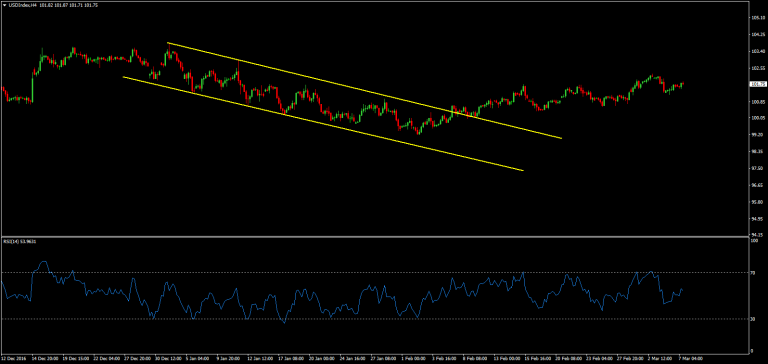
So, in this instance we can see that price is trending lower in the channel however from this point here you can see that the indicator is starting to put in higher lows indicating waning bearish momentum. So, once we identify a channel such as this we then want to keep an eye on the RSI indicator and once we start to see divergence. We then know that a reversal is likely and so we know to keep a closer eye on the setup as it develops.
Again, as with trading the range breakout in the direction of the trend, the best way to operate this strategy is where the channel forms as a correction to a trend and then the break signals the resumption of the trend. Breakout trading in this manner can be a powerful way to enter a trending market at a great level.


