


TL;DR: Friday’s US CPI can push Gold toward either edge of its 4,230–4,697 range, but the Fed’s expected rate peak, oil’s physical normalization, and the Dollar debasement trade are all bigger stories than one inflation print — and only those can actually break the range.
Friday Can Move Gold. Something Bigger Has to Break It.
Friday’s CPI could send Gold higher or lower without actually deciding very much. That may sound counterintuitive when inflation is the decisive input for a Fed meeting just five days later. CME FedWatch currently puts a September hike at 58.6%, against 41.4% for a hold, leaving plenty of room for Friday’s number to shift the immediate odds.
But Gold’s problem is bigger than September. Since reaching 4,697.07, the metal has failed in both directions. The selloff never developed into a sustained breakdown. The recovery stalled at 4,510.90. Momentum has faded without collapsing, leaving Gold rotating inside a much broader technical structure whose important boundaries sit around 4,230 and 4,697.
The market is indecisive for a reason. The Fed path is already difficult to make dramatically more hawkish. At the same time, the catalysts capable of producing a genuine upside breakout are larger stories than anything on this week’s calendar. CPI can move Gold within the range. Something bigger probably has to break it.
The Fed Can Still Change the Timing, but How Much Can It Change the Ceiling?
The September meeting itself is unresolved. Markets currently see a modestly better-than-even chance the Fed raises rates by 25bp to 3.75–4.00% on September 16, while a hold at 3.50–3.75% still carries substantial probability. Friday’s inflation report can clearly move that balance.
But follow the curve beyond September and a different picture appears. Markets price roughly 0.83 cumulative hikes by October, 1.34 by December, 1.57 by January, and 1.94 by March 2027. From there, the expected path largely flattens, with the 4.00–4.25% range becoming the largest single probability bucket from March onward.
Put simply, markets are comfortable pricing one hike. They substantially price a second. They’re not seriously building a third into the base case. That matters enormously for Gold.
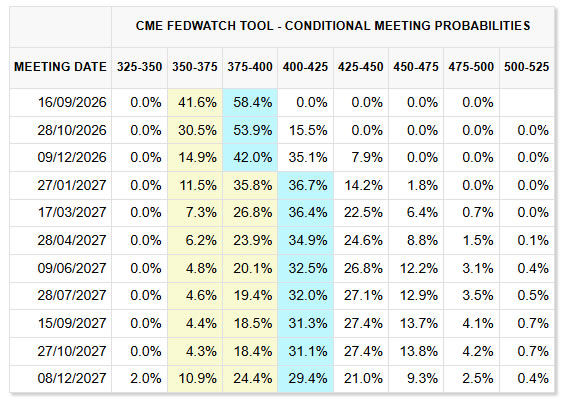
A hot CPI report can make September more likely. It can bring the second hike forward. It can push Treasury yields higher and strengthen the Dollar. But if the expected peak in rates barely changes, the longer-term monetary argument against Gold hasn’t fundamentally changed either. For a sustained downside break, Friday probably has to do more than move the next meeting — it has to make investors rethink how high the Fed ultimately needs to go.
The Same Constraint Works in Gold’s Favor, but Only Up to a Point
A soft inflation reading produces the mirror image. September hike odds would probably fall. Yields could retreat. The Dollar could weaken. Gold would have a clear reason to recover.
But a single benign print isn’t necessarily enough to erase the rest of the tightening path. Governor Christopher Waller has framed his own decision around whether inflation shows continued progress. That distinction matters — “continued” requires a pattern rather than one favorable release. A weak CPI number could therefore change September without settling December or March.
The same is true in reverse. One hot number can revive inflation concerns without proving disinflation has structurally reversed. This symmetry is one reason the current Gold range has been difficult to escape. Both CPI tails can move price. Neither automatically changes the entire Fed story.
The Long End Has Another Source of Resistance to Higher Yields
Treasury buybacks add a secondary element to that downside protection. From September 9 through November 4, Treasury operations include purchases of longer-dated coupon securities in the 10–20-year and 20–30-year sectors.
Removing some of that duration from private hands can relieve part of the pressure on longer-term yields. The effect shouldn’t be overstated — the broader financing implications are more complicated once issuance elsewhere is considered, and the operations don’t create a simple mechanical ceiling for Treasury yields. But they do matter at the margin.
For Gold, that means another factor can push against an uncontrolled long-end yield rise even while the Fed debate remains hawkish. The bigger point still holds: to break Gold decisively lower, the rates story probably needs to become more hawkish in degree, not merely in timing.
Why 4,697 Is Harder Than It Looks
If the Fed path helps explain why Gold has been difficult to break down, it doesn’t explain why Gold has failed to break higher. For that, the market needs another catalyst.
One possibility lies in the Strait of Hormuz — but not in the simple geopolitical sense. A genuine reopening of oil traffic would initially reduce geopolitical demand for Gold. That channel is straightforwardly negative.
But a durable normalization that brought oil materially lower could also reduce the inflation pressure confronting the Fed and other major central banks. If the change became large enough to alter the global rates outlook, falling yields could eventually provide a much stronger monetary tailwind for Gold. The key is physical normalization, not another headline about negotiations or partial flows. Gold needs an oil move large enough to change the inflation regime. That’s unlikely to be settled by Friday.
Gold Also Needs the Dollar Story to Reawaken
There’s another route higher: a renewed Dollar debasement trade. That’s different from ordinary speculation over whether the Fed hikes in September or December. A broad move away from Dollar-denominated assets as stores of value can support Gold even when conventional rate relationships are less favorable. It reflects questions around fiscal credibility, institutional confidence, and longer-term reserve diversification rather than merely the next 25bp move from the Fed.
For Gold to break 4,697.07 on that basis, however, the trade probably needs to become broad again. It would need to show up not just in Gold itself, but in persistent Dollar weakness and wider evidence that investors are shifting away from US assets or demanding a greater credibility premium. That kind of process develops over weeks or months. Friday’s CPI can influence it. It can’t settle it.
ActionForex’s Technical View on Gold: The Charts Are Telling the Same Story
The technical structure is just as indecisive as the macro picture. Gold’s rally from 3,942.43 to 4,697.07 can be counted as a five-wave advance. Since the peak, price action remains consistent with a correction against that rise rather than clear evidence the larger decline has resumed.
The sequence is: 4,697.07 → 4,282.23 → 4,510.90 → renewed pullback.
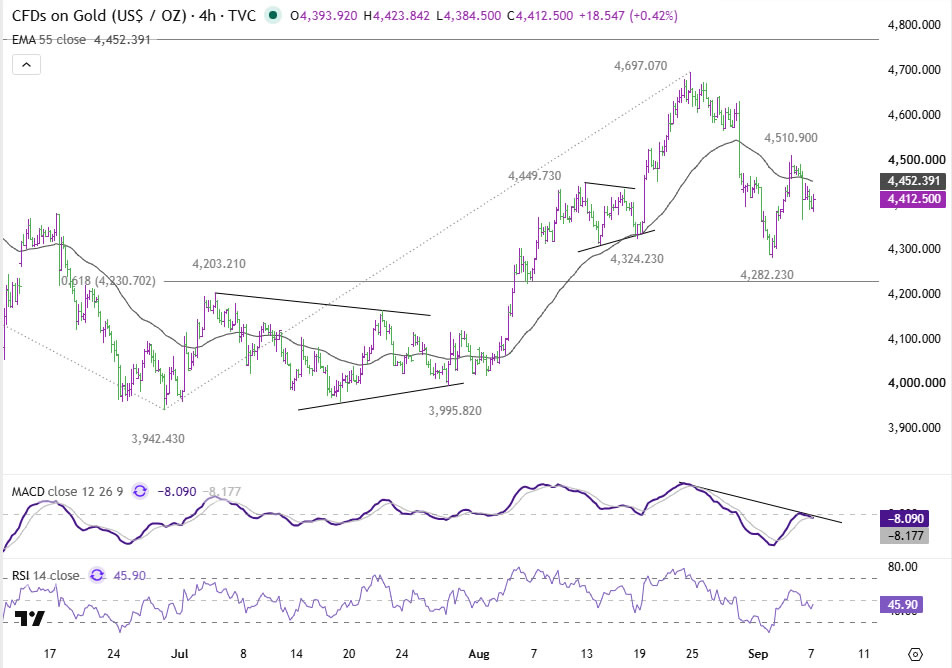
The first downside level is 4,282.23, where the initial decline found support. But the level that matters more for the larger structure sits below it. The 61.8% retracement of the entire 3,942.43–4,697.07 rally lies at 4,230.70. That’s the real structural floor.
Gold can test 4,282 and still remain comfortably inside a corrective pattern. A sustained break through the 4,230 region would carry much greater significance, because it would weaken the argument that the post-4,697 decline is simply correcting the five-wave advance. That’s why 4,230, rather than the latest swing low, belongs in the headline range.
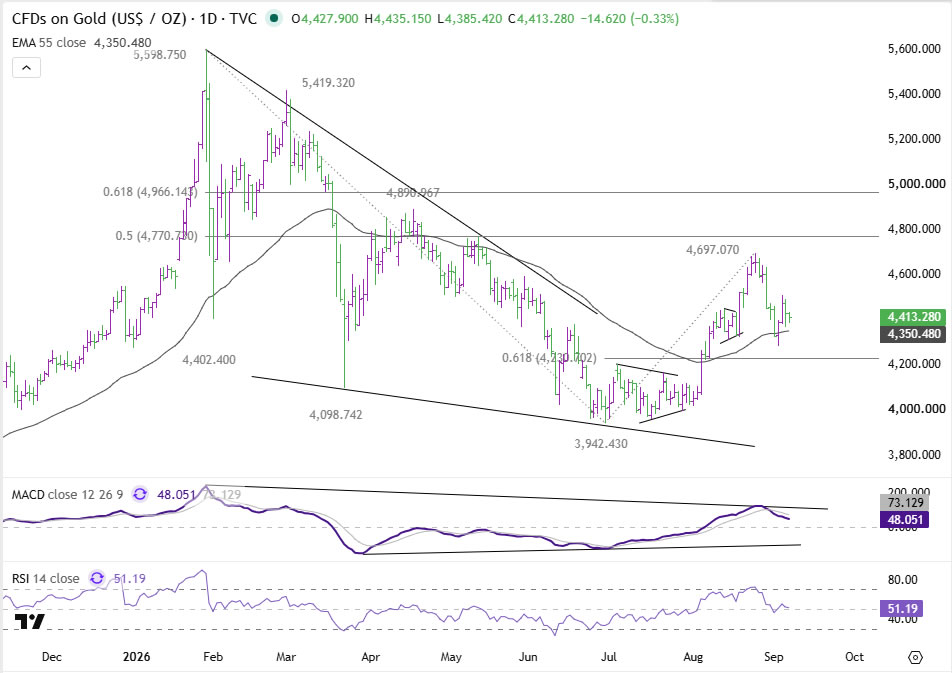
The same distinction applies on the upside. The immediate pivot is 4,510.90. Breaking it would indicate the first corrective leg probably ended at 4,282.23 and would reopen the path toward the August high. But that’s not the same thing as breaking out. The real ceiling remains 4,697.07. Strong resistance can be expected there if Gold returns for another test, so even a bullish break through 4,510 may simply carry price from the middle of the range back toward its upper boundary.
That’s exactly what the broader macro setup would suggest. A soft CPI report can generate a rally. A decisive move through 4,697 probably needs something more.
CPI May Decide the Next Stop, Not the Final Destination
Friday still matters. A sufficiently hot inflation print could drive Gold toward 4,282 and potentially 4,230, particularly if Treasury yields and the Dollar respond strongly. A softer print could put 4,510.90 back into play and reopen another challenge of 4,697.07.
But the real test comes afterward. Did markets simply move the September hike probability? Did they bring the second hike forward? Or did they actually start pricing a materially higher — or lower — endpoint for the Fed cycle? Only the last of those would represent the kind of monetary shift capable of materially changing the Gold structure.
The same applies to the upside. A genuine breakout probably needs the oil and inflation regime to change more substantially, or the Dollar debasement trade to regain enough force to challenge the upper boundary. That’s why Gold is waiting on something bigger than Friday’s CPI. The inflation report may determine which edge of the range comes next. The bigger macro stories will determine whether 4,230 or 4,697 finally gives way.
Key Takeaways
- Gold has failed to break either 4,230 or 4,697 since peaking at 4,697.07, reflecting a Fed path that’s hard to make dramatically more hawkish and no catalyst large enough to force a breakout.
- Markets price roughly two Fed hikes over the next year but aren’t building in a third, meaning even a hot CPI print likely shifts timing rather than the expected rate ceiling.
- Treasury buybacks from September 9 through November 4 add a secondary, if modest, source of resistance to a runaway rise in long-end yields.
- A genuine upside breakout likely requires physical Hormuz normalization large enough to change the inflation regime, or a broad renewed Dollar debasement trade, not one data point.
- 4,230.70 is the real structural floor and 4,697.07 the real ceiling; Friday’s CPI can move Gold toward 4,282/4,230 or 4,510.90/4,697, but probably won’t resolve the range itself.





