


Key Highlights
- WTI Crude Oil started a sharp downside correction from $106.75.
- It traded below a bullish trend line with support at $100.50 on the 4-hour chart of XTI/USD.
- EUR/USD struggled below 1.1520 and might see more downsides.
- GBP/USD started a consolidation phase after a major drop to 1.3330.
WTI Crude Oil Price Technical Analysis
WTI Crude Oil prices failed to stay above $102.00 against the US Dollar. The price dipped below $100.00 and $98.00 to enter a short-term bearish zone.
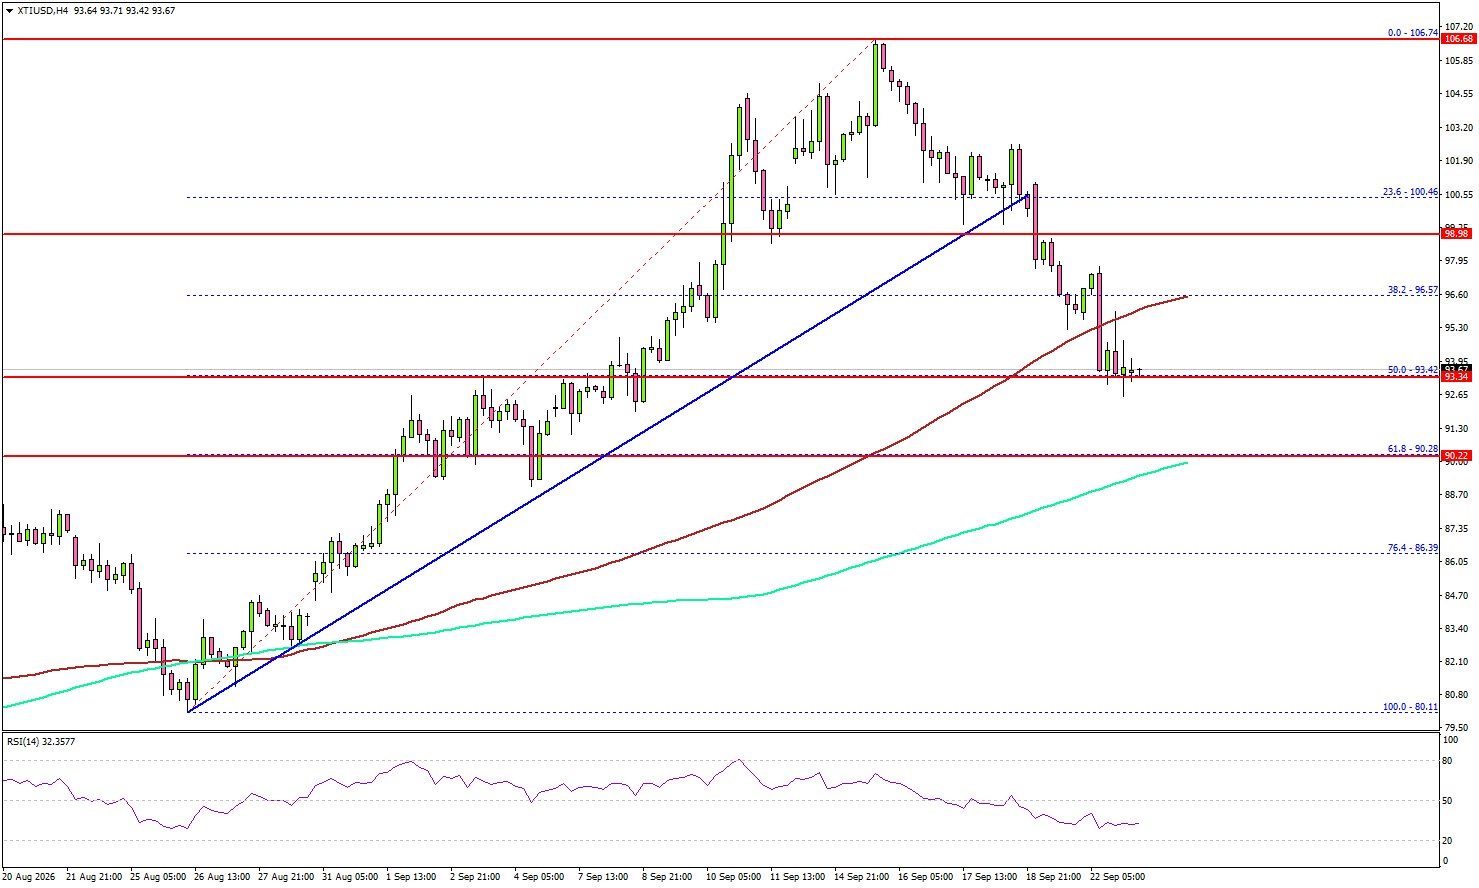
Looking at the 4-hour chart of XTI/USD, the price traded below a bullish trend line with support at $100.50. The price even traded below the 100 simple moving average (red, 4-hour) and tested the 50% Fibonacci retracement level of the upward move from the $80.11 swing low to the $106.74 high.
If the bears remain in action, the price could test the $91.20 level. The main support could near the 61.8% Fibonacci retracement and the 200 simple moving average (green, 4-hour) at $90.00.
If there are more losses, the price might find support at $86.40. On the upside, the price could face resistance at $96.50.
The next resistance might be $99.00. The first hurdle for steady gains could be $102.00. A close above $102.00 could send Oil prices toward $105.00. The main resistance could now be $106.75.
Looking at EUR/USD, the bears remained in action, pushed the pair below 1.1465, and might aim for a drop to 1.1420.
Economic Releases to Watch Today
- Eurozone Manufacturing PMI for Sep 2026 (Preliminary) – Forecast 52.7, versus 52.7 previous.
- Eurozone Services PMI for Sep 2026 (Preliminary) – Forecast 51.7, versus 51.6 previous.
- US S&P Global Manufacturing PMI for Sep 2026 (Preliminary) – Forecast 53.5, versus 53.9 previous.
- US S&P Global Services PMI for Sep 2026 (Preliminary) – Forecast 56.0, versus 56.5 previous.





