


TL;DR: Gold has held its 4,230.70 support through a sharp Treasury yield surge to multi-decade highs, but the real test isn’t whether it can absorb a short-lived spike—it’s whether that support survives a sustained regime with the 10-year yield staying above 5%.
Gold Has Survived the Yield Shock
Gold has already survived something that should have hurt much more. Treasury yields have climbed to multi-decade highs, Fed tightening expectations have accelerated, and the Dollar remains firm—yet gold is still holding above 4,230, a key near-term Fibonacci support. The harder test may only be beginning: not whether yields spike, but whether they stay this high.
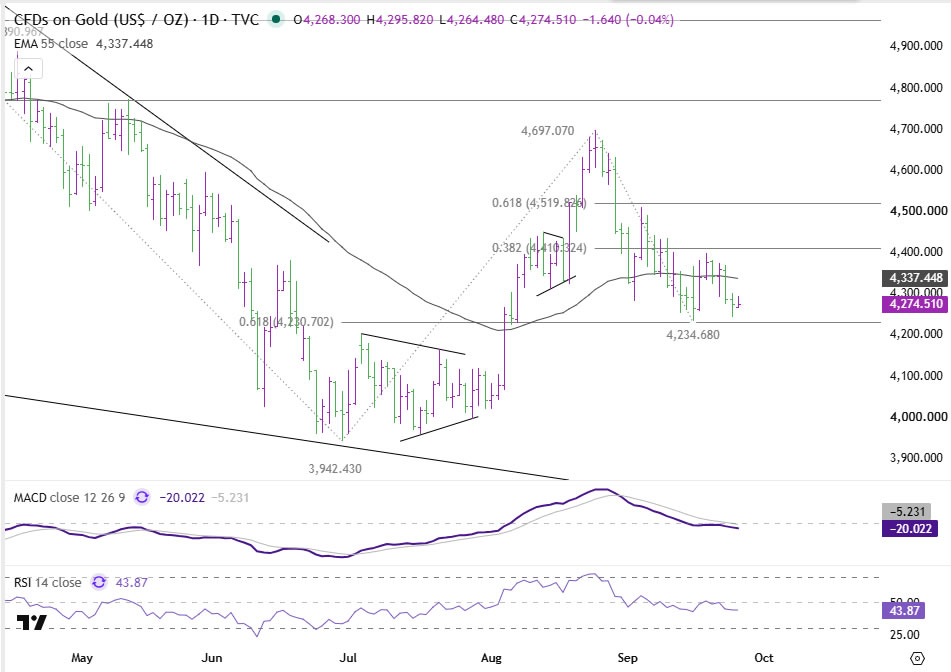
At around 4,275, gold remains well above the 3,942.43 June low, despite the increasingly hostile rates backdrop. More importantly, this week’s sharp Treasury selloff failed to force a break of 4,230.70, the 61.8% retracement of the rise from 3,942.43 to the 4,697.07 peak. Gold has therefore absorbed both the gradual rise in yields over recent months and the latest abrupt repricing without losing the support that defines its broader corrective structure.
That’s genuine resilience. But it’s not the same thing as renewed strength.
Resilient, but Increasingly Vulnerable
The fundamental pressure on gold hasn’t stabilized. Markets are pricing a substantially greater probability of further Fed tightening, the US 10-year yield has pushed above 5%, and the Dollar remains broadly firm. Those forces continue to raise the opportunity cost of holding a non-yielding asset.
The charts reflect that pressure. Gold is trading below both the 4H 55 EMA at 4,326.16 and the daily 55 EMA at 4,337.45, leaving immediate price action capped beneath moving averages on two timeframes simultaneously.
Momentum is also soft rather than exhausted. The 4H RSI at 40.88 and daily RSI at 43.87 are both below 50 but still have substantial room to fall before reaching oversold territory. MACD remains negative on both timeframes, with the deterioration on the daily chart particularly pronounced. In other words, gold’s price structure has held up better than its momentum structure.
That combination preserves the resilient-but-vulnerable framing: bears haven’t broken the level that matters, but bulls haven’t regained control either.
The Harder Test Is Yields Staying High
The market question has now changed.
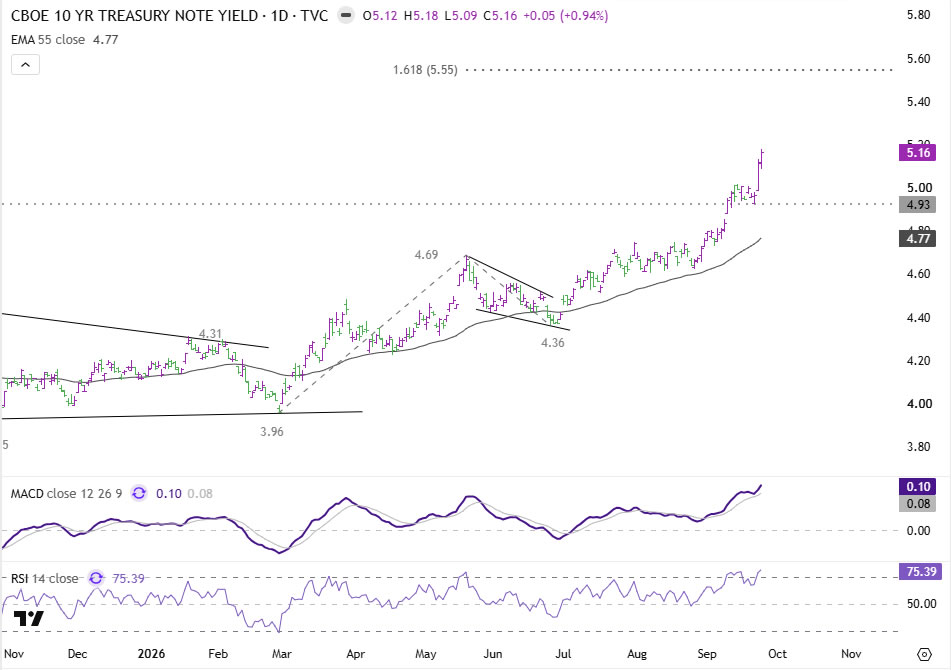
Earlier, the issue was whether gold could withstand rising Treasury yields. It largely has. Even this week’s rapid push in the 10-year and 30-year to multi-decade highs wasn’t enough to break the key support zone.
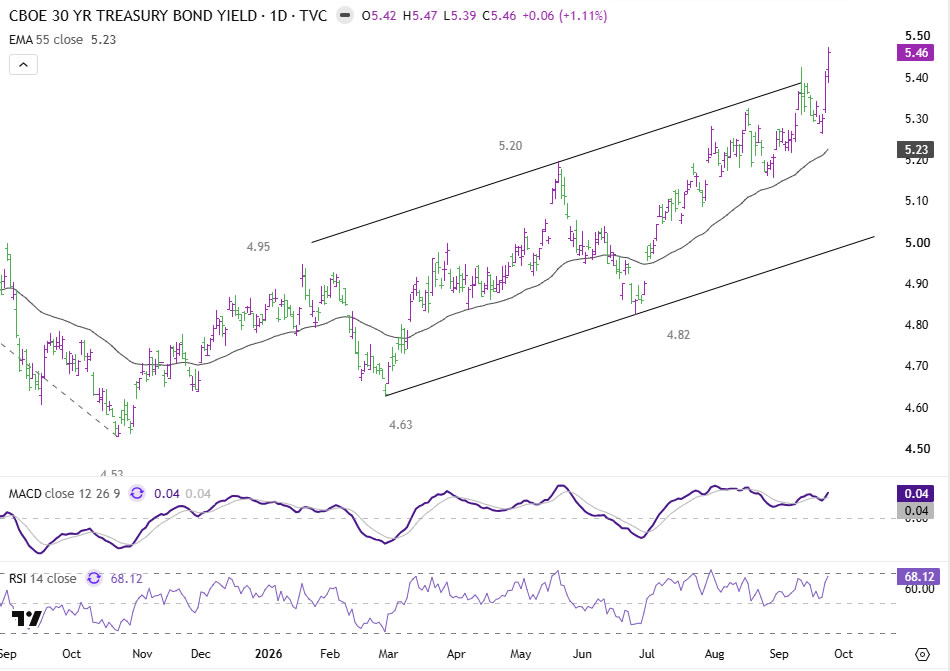
But a short-lived yield shock and a sustained high-yield regime are different things.
If the 10-year remains above or around 5% while Fed expectations continue shifting toward additional tightening, gold faces a more persistent headwind. A temporary spike can be absorbed. Weeks of elevated yields, a firm Dollar, and expectations of further rate increases would continuously pressure the relative attraction of holding gold.
That’s the test the market hasn’t completed yet.
ActionForex’s Technical View on Gold: 4,230 Is the Line That Matters
Technically, the decline from 4,697.07 remains corrective rather than conclusively bearish. Price action has been overlapping and choppy rather than developing into a clean directional collapse, while repeated attempts to push below the low-4,200s have failed.
The key floor remains 4,230.70, with the recent low at 4,234.68 effectively retesting that area.
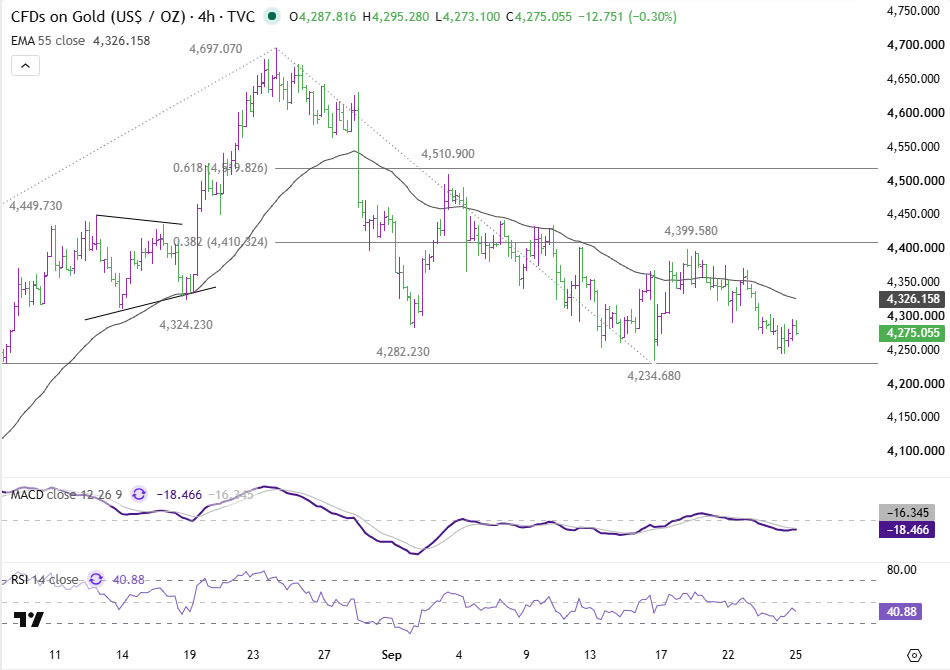
The importance of this level is asymmetric. A rebound above nearby resistance would show improving momentum, but a decisive break below 4,230.70 would undermine the central resilience argument itself. It would mean the support that survived both the gradual yield climb and the latest rates shock had finally failed. Such a break would reopen the broader 3,942.43 low as the next major downside reference.
Bulls Have Several Hurdles to Clear
On the upside, gold first needs to reclaim the 4,326–4,337 area defined by the 4H and daily 55 EMAs. That would ease immediate downside pressure but wouldn’t by itself signal the correction from 4,697.07 is finished.
A more meaningful recovery requires a break above the 4,410 area, followed by the broader 4,410–4,520 resistance zone. A sustained move through that cluster would materially strengthen the case that the corrective phase is ending and put 4,697.07 back into focus.
Until then, rebounds remain vulnerable to selling into resistance. That creates a relatively clean structure:
- Above 4,410–4,520, the correction begins to lose control, reopening 4,697.07.
- Below 4,230.70, the resilience thesis weakens sharply, reopening 3,942.43.
Gold Has Held—Now It Must Prove It Can Keep Holding
Gold’s relative stability through the Treasury breakout is noteworthy. The metal hasn’t ignored higher yields—the decline from 4,697.07 makes that clear—but neither has it capitulated despite an increasingly difficult macro backdrop.
That makes gold resilient, but still vulnerable.
The next meaningful signal won’t come from another intraday move around 4,275. It will come from whether 4,230.70 survives a sustained period of Treasury yields above 5%, and whether gold can reclaim both 55 EMAs before rates find another leg higher.
Upcoming US payrolls and CPI could determine whether the rates pressure intensifies or finally eases. If neither changes the Fed narrative, gold may have to prove its support can withstand something harder than a yield shock: a high-yield regime that refuses to go away.
Key Takeaways
- Gold held 4,230.70 support through a sharp Treasury selloff that pushed the 10-year yield above 5% for the first time in multi-decade highs.
- Gold’s price structure has held up better than its momentum structure: it’s below both 55 EMAs (4,326.16 4H, 4,337.45 daily) with RSI soft on both timeframes.
- The real test has shifted from whether gold can absorb a yield spike to whether it can withstand a sustained regime of yields staying above 5%.
- A break below 4,230.70 would undermine the resilience thesis and reopen the 3,942.43 June low; a break above the 4,410-4,520 zone would instead reopen 4,697.07.
- Upcoming US payrolls and CPI are the next catalysts that could determine whether rate pressure on gold intensifies or eases.





