


TL;DR: October Fed hike odds have surged to 69.7% on a booming flash PMI, driving the 2-year and 10-year Treasury yields to fresh multi-year highs—and pushing EUR/USD toward a structural decision zone at 1.1323–1.1353.
Markets Pull the Next Fed Hike Forward
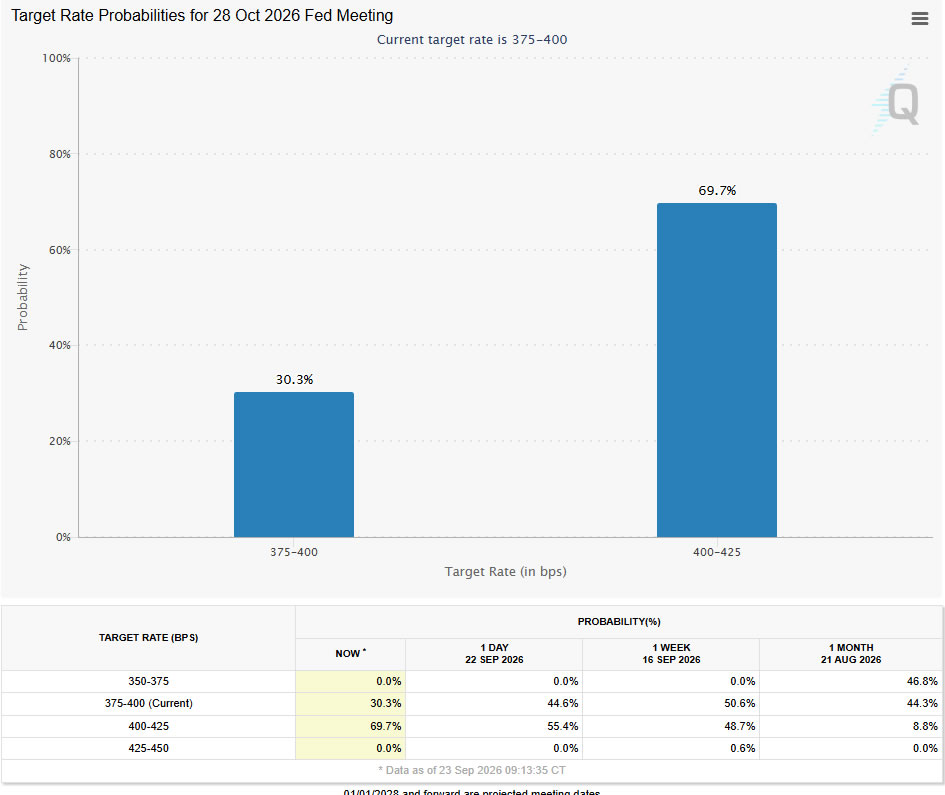
A booming US economy is increasingly looking like a bond-market problem. Expectations for another Federal Reserve hike at the October 28 meeting have surged to 69.7%, according to the latest FedWatch snapshot, up from 55.4% a day earlier, 48.7% a week ago, and just 8.8% a month ago. The repricing comes only a week after the Fed delivered its first hike since 2023, lifting the target range by 25bp to 3.75–4.00%. Markets are no longer simply debating whether the tightening cycle has further to run; they’re increasingly pricing back-to-back hikes.
Treasuries have responded accordingly. The 2-year yield has surged to around 4.89%, its highest since May 2024, while the 10-year has climbed above 5.10% to its highest since 2007. Wednesday’s rise in the 10-year was the largest one-day move since April 2025. The front end is being driven predominantly by the repricing of near-term Fed policy, while longer maturities are absorbing the same growth and inflation signal alongside concerns over Treasury supply and investor demand.
Hot PMI Turns Strong Growth Into a Hawkish Signal
The immediate macro catalyst was an exceptionally strong September flash PMI report. PMI Manufacturing rose from 53.9 to 57.0, PMI Services from 56.5 to 58.7, and PMI Composite from 56.0 to 58.4, the latter reaching a 62-month high. Manufacturing output also accelerated from 53.1 to 56.7. S&P Global Chief Business Economist Chris Williamson said US business is “clearly booming now in both manufacturing and services,” with the survey consistent with roughly 5% annualized growth at the latest pace and around 4% for the third quarter as a whole.
But it was the inflation side that turned strong growth into a bond-negative signal. Backlogs rose sharply, hiring accelerated, and capacity strains intensified, while overall input-cost inflation reached its highest since October 2022. Williamson said firms’ input costs jumped at the steepest rate in four years, with fuel and transport costs rising sharply as oil prices climbed. That connects Wednesday’s rebound in Brent—settling up 3.86% at $103.08—directly back into the inflation picture rather than treating oil as a separate market story.
The mechanism is increasingly difficult for bond bulls: strong domestic demand is tightening capacity at the same time as higher energy costs are adding another layer of price pressure. That leaves the Fed with less reason to tolerate inflation staying above target, especially while employment remains resilient.
Fed Hawkishness and Weak Auction Demand Add to the Selloff
The PMI landed on top of an increasingly hawkish run of Fed communication. Federal Reserve Governor Michael Barr said this week that policymakers had been “out of position” before the September hike and that, in his base case, “further policy adjustments are likely to be needed to ensure inflation comes down to target in a timely fashion.” Alberto Musalem has described policy as being “on the accommodative side,” Susan Collins has backed another hike later this year, and Austan Goolsbee has warned that persistent supply shocks and excessive demand can’t simply be looked through.
The result is that incoming data and Fed rhetoric are now reinforcing each other rather than pulling in opposite directions. The September hike increasingly looks less like a one-off correction and more like the possible start of a renewed tightening sequence.
A weak $70bn 5-year Treasury auction then added another layer of pressure. The auction cleared at 5.033%, compared with a roughly 4.186% average across the previous six auctions, while indirect bidders took just 54%, versus an average around 65%. The 5-year sits in the belly of the curve rather than the long end, but the poor demand reinforced the broader message that investors require more compensation to absorb Treasury supply. The auction therefore amplified a selloff already fundamentally justified by stronger growth, higher inflation pressure, and rising Fed expectations.
ActionForex’s Technical View on the 2-Year Yield: Breaks Through 4.791%
The technical breakout in the 2-year yield reflects how quickly markets have brought the next Fed move forward.
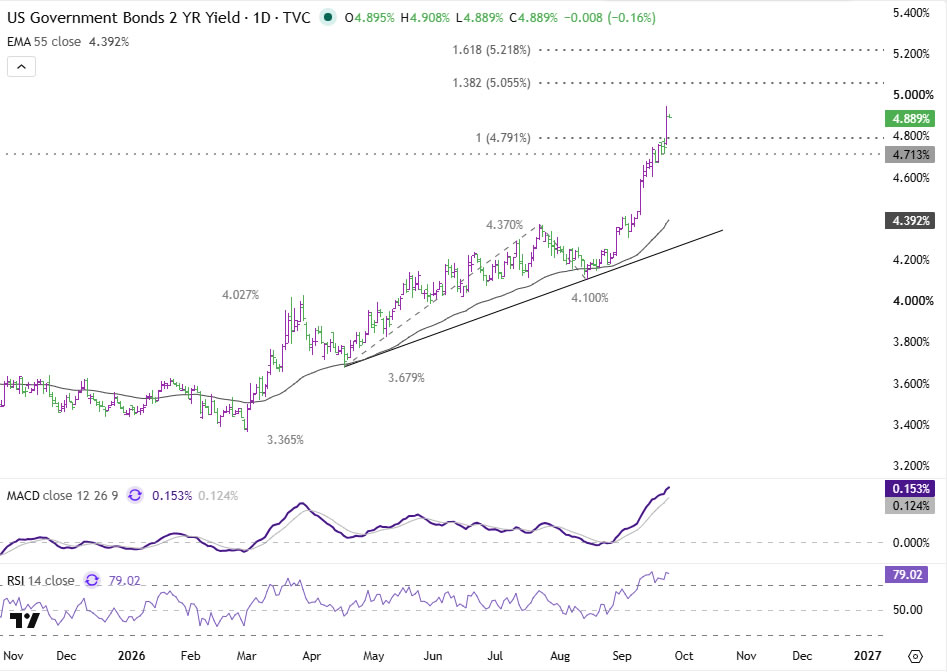
The yield has decisively cleared the 4.791% 100% projection of the rise from 3.679% to 4.370% projected from 4.100%. That was a key resistance level and had already been identified as the next major test after last week’s FOMC repricing.
Momentum remains strongly positive. Daily MACD continues to rise, while RSI near 79 is clearly overbought but hasn’t produced a topping signal.
The next target is the 138.2% projection at 5.055%, immediately above the psychological 5% level. Beyond there, the 161.8% projection stands at 5.218%.
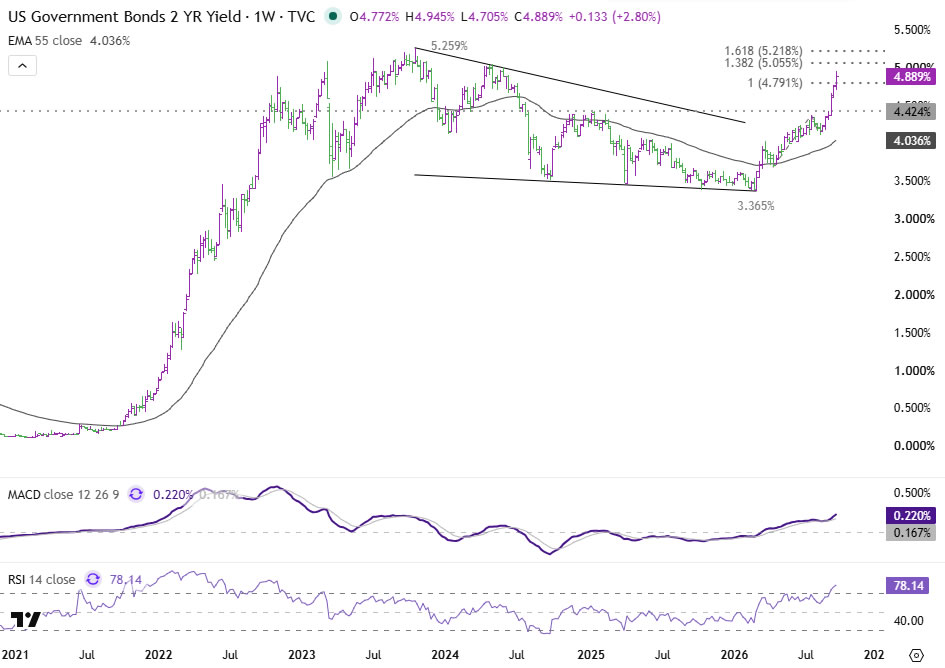
The weekly structure raises an even larger question. The decline from the 5.259% 2023 high to 3.365% increasingly looks complete. Current momentum makes a retest of 5.259% increasingly plausible, but a break of that level would still be required before concluding the longer-term yield uptrend has resumed.
ActionForex’s Technical View on the 10-Year Yield: A Three-Way Resistance Cluster
The 10-year yield is already at an even more immediate technical decision point.
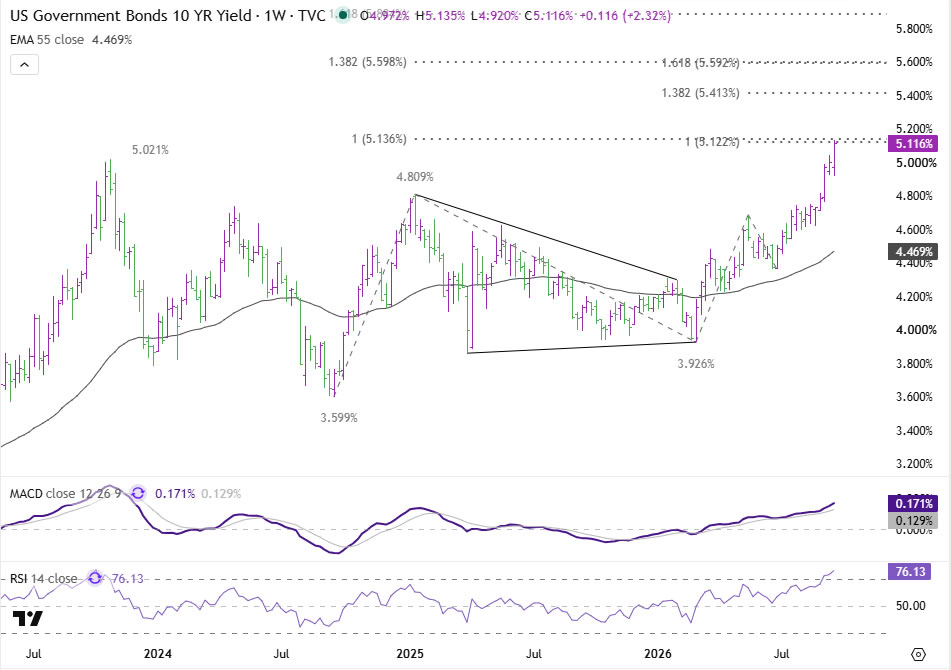
At around 5.116%, it’s pressing directly beneath a tight resistance cluster:
- 5.122% — 100% projection of 3.926% to 4.687% from 4.361%
- The upper boundary of the medium-term rising channel
- 5.136% — 100% projection of 3.599% to 4.809% from 3.926%
That 5.122–5.136% zone is therefore the key breakout area.
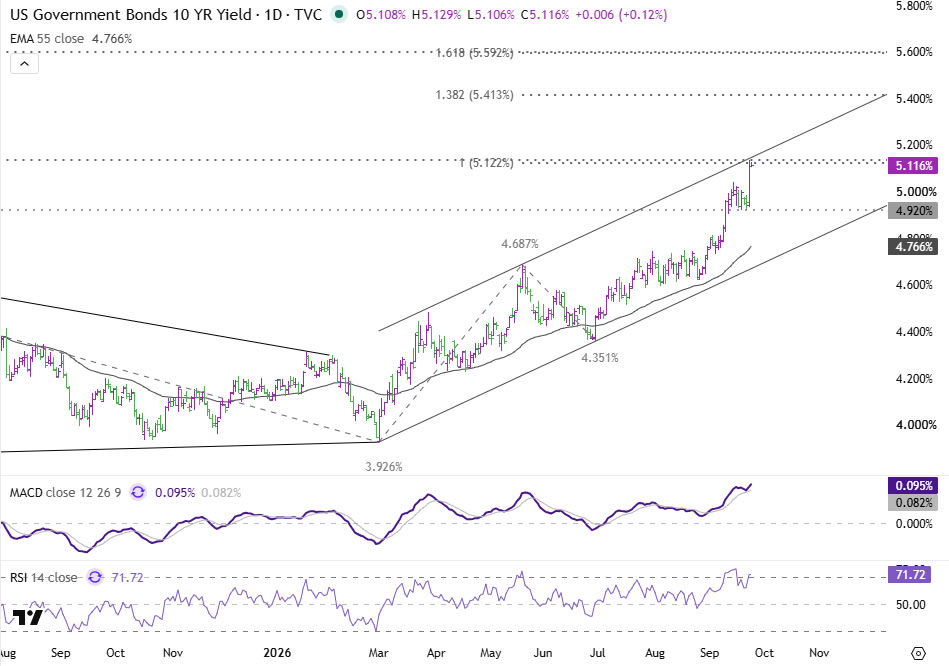
Daily RSI around 72 and weekly RSI around 76 show increasingly stretched momentum, so some consolidation would be normal. But overbought conditions aren’t themselves a reversal signal. As long as 4.920% support holds, the near-term structure remains bullish.
A decisive break through the 5.12–5.14% cluster would open the 138.2% projection at 5.413%.
The broader significance is already substantial. The 10-year has pushed above the 5.021% 2023 high, transforming the current move from another test of old resistance into a genuine multi-year breakout.
ActionForex’s Technical View on EUR/USD: Reaching a Structural Decision Zone
The widening US yield advantage is now feeding directly into FX.
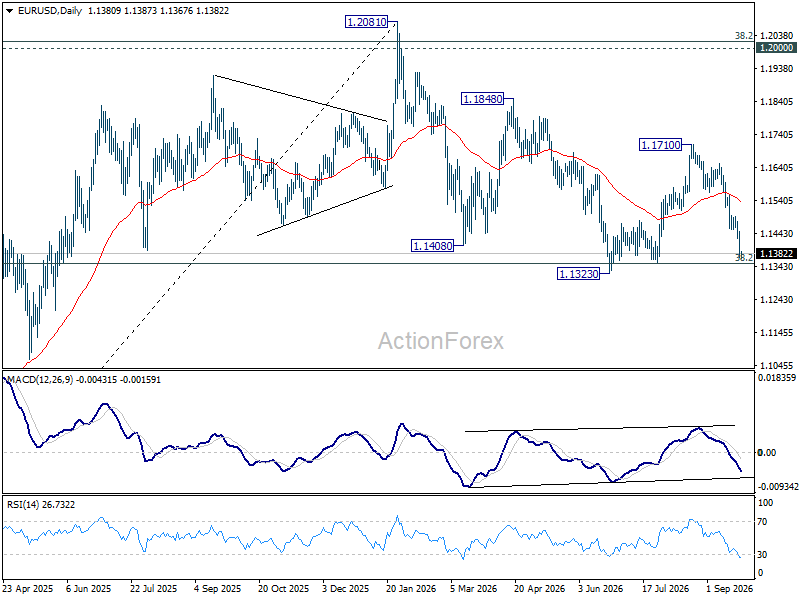
EUR/USD has accelerated lower toward the 1.1353 level, the 38.2% retracement of the rise from 1.0176 to 1.2081, with 1.1323 support immediately underneath. Together, the two levels create a compact 1.1323–1.1353 decision zone.
Daily momentum is deeply bearish. MACD has accelerated lower and RSI is already near 27, leaving the pair oversold enough for a short-term rebound but not yet providing evidence the decline is finished.
A decisive break through 1.1323 would first confirm resumption of the fall from 1.2081.
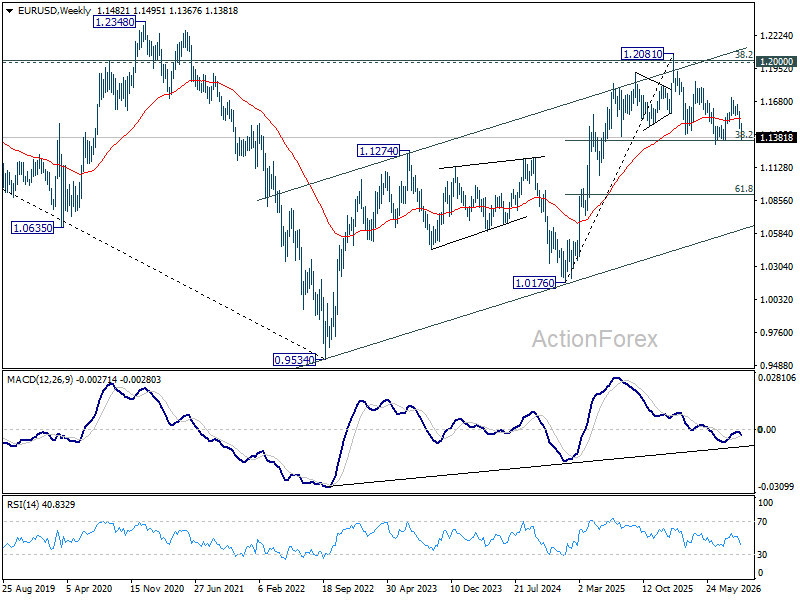
The more important implication lies on the weekly chart. The entire advance from the 0.9534 low in 2022 to 1.2081 can still be interpreted as a corrective three-wave rebound. EUR/USD failed around the 1.20–1.2081 resistance cluster, and a clear break through 1.1323 would materially increase the probability that 1.2081 completed that entire corrective rally.
Under that scenario, the next major medium-term downside objective would be the 61.8% retracement at 1.0904.
Payrolls and CPI Hold the Veto
The cross-market chain is now unusually coherent: Brent back above $100 is feeding into fuel and transport costs; the PMI shows strong growth alongside renewed inflation pressure; Fed officials are arguing that more restraint may be necessary; October hike odds have climbed toward 70%; Treasury yields are breaking higher; and EUR/USD is approaching structural support.
The weak Treasury auction has intensified that move, but it didn’t create it.
The principal risk to the entire repricing is now incoming US data. A materially softer payrolls report or benign inflation print before the October FOMC could quickly pull hike probabilities lower and trigger consolidation in yields.
Absent that, the immediate technical tests are clear: 5.055% on the 2-year, 5.122–5.136% on the 10-year, and 1.1323–1.1353 on EUR/USD. A simultaneous break in yields and EUR/USD would turn this week’s repricing into something much more consequential.
Key Takeaways
- October Fed hike odds jumped from 8.8% a month ago to 69.7% now, driven by a 62-month-high flash PMI Composite reading of 58.4.
- Input-cost inflation hit its highest since October 2022, with Brent’s rebound to $103.08 feeding directly into fuel and transport costs, turning strong growth into a hawkish signal.
- A weak $70bn 5-year Treasury auction (5.033% clearing yield vs. 4.186% recent average) amplified, but didn’t create, a selloff already justified by growth and inflation data.
- The 2-year yield broke 4.791% resistance toward 5.055%, while the 10-year is testing a three-way 5.122-5.136% resistance cluster after clearing its 2023 high.
- EUR/USD faces a structural 1.1323-1.1353 decision zone; a break of 1.1323 would raise the odds the entire 2022-2026 advance from 0.9534 completed as a corrective rally, opening 1.0904 next.





