


Key Highlights
- Gold declined toward $4,120 and started a consolidation phase.
- A bearish trend line is forming with resistance at $4,260 on the 4-hour chart.
- WTI Crude Oil dipped below $92.50 and might extend losses.
- EUR/USD is still showing bearish signs below 1.1275.
Gold Price Technical Analysis
Gold failed to stay above $4,250 and declined further against the US Dollar. The price dipped below $4,200 and even tested the $4,120 support.
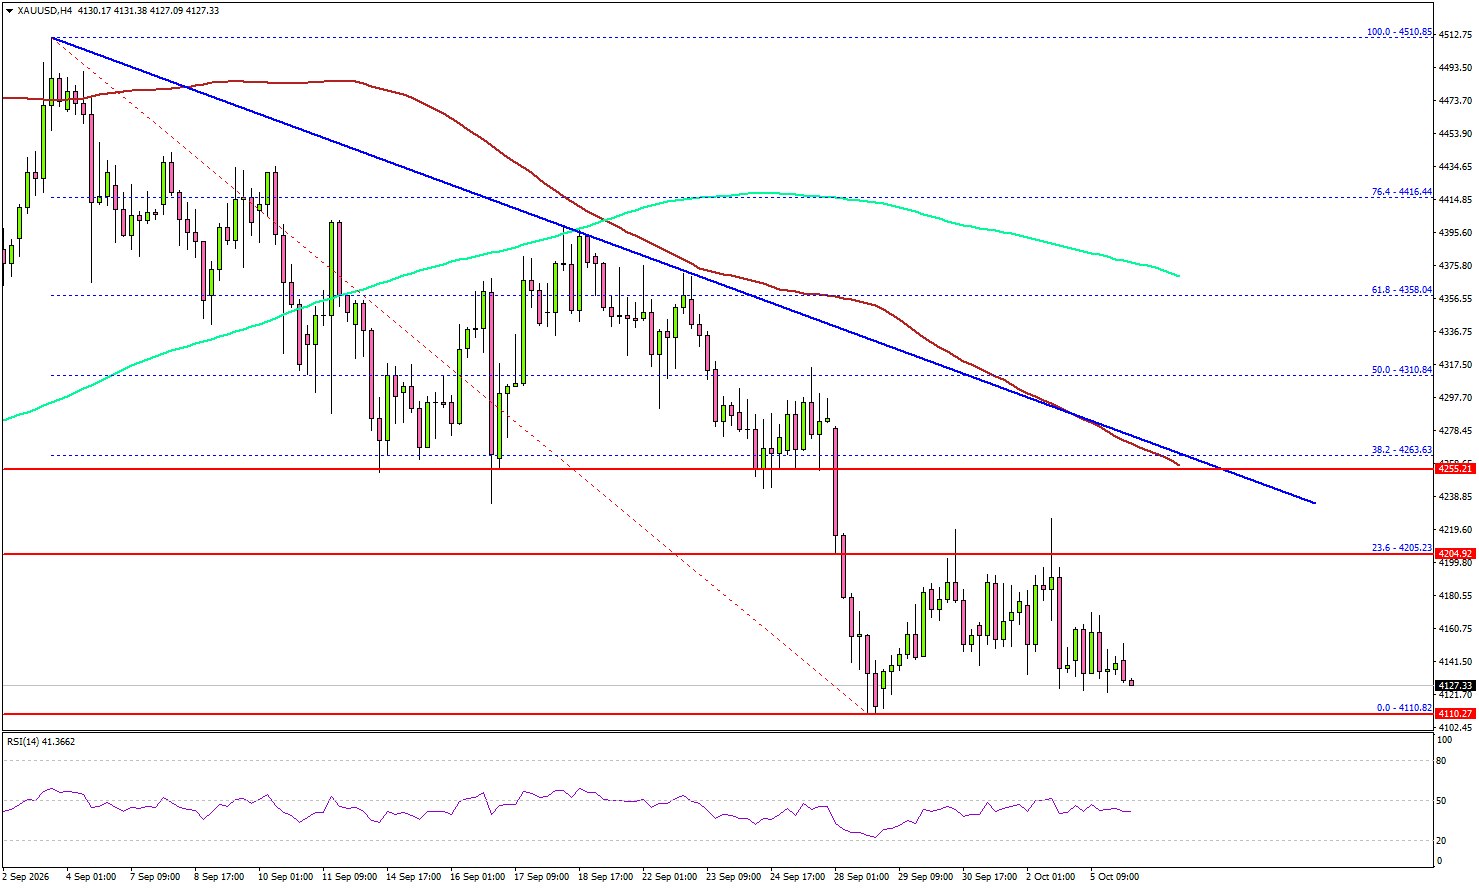
The 4-hour chart of XAU/USD indicates that the price traded as low as $4,110 and settled well below the 100 Simple Moving Average (red, 4 hours) and the 200 Simple Moving Average (green, 4 hours). The bulls attempted a recovery wave but faced resistance near the 23.6% Fib retracement level of the downward move from the $4,510 swing high to the $4,110 low at $4,200.
The first key resistance could be $4,260, the 100 Simple Moving Average (red, 4 hours), and a bearish trend line. A close above $4,260 could send the price toward the 50% Fib retracement level at $4,310.
The main resistance might be near the 200 Simple Moving Average (green, 4 hours) at $4,375. A clear move above $4,375 could open the door for more upside. In the stated case, the bulls could aim for a move toward $4,500.
If there is a fresh decline, the price could test $4,080. The first major support sits at $4,050. The next support could be $4,000, below which the price might slide to $3,850.
Looking at EUR/USD, the bears remained in action and might aim for a drop below 1.1120 in the coming sessions.
Economic Releases to Watch Today
- Fed’s Williams speech.
- Fed’s Bowman speech.





