


TL;DR: Gold fell to 4,066.21 before recovering toward 4,120, and while the near-term bias stays bearish below 4,227.85–4,245.68, fading downside momentum, a stalling 10-year yield near 5.3%, and a rising Gold/Silver ratio suggest a break below 4,000 may struggle to extend much past the 3,937–3,942 support cluster.
Why This Matters
Gold’s selloff is approaching a potentially important test below 4,000. The metal fell to 4,066.21 on Wednesday before recovering toward 4,120, while the near-term bias remains bearish below the 4,227.85–4,245.68 resistance zone.
But the setup is becoming less one-sided. The US 10-year yield has started to meet strong demand around 5.3% and is approaching a major resistance area of its own, raising the possibility of a corrective pullback in yields. At the same time, the Gold/Silver ratio is turning higher, suggesting that selling pressure within precious metals is increasingly shifting toward Silver rather than Gold.
Neither development is enough to call a Gold bottom. But together with fading downside momentum on Gold’s 4-hour chart, they raise the possibility that a break below 4,000 may prove harder to extend than the headline level suggests. The real technical test lies slightly lower at 3,937–3,942, where the current decline reaches a major projection target and the July low.
Real Yields Remain the Main Macro Headwind
The US 10-year yield’s recent surge toward 5.36% has therefore been more important for Gold than the inflation-hedge narrative.
Fed officials still see inflation risks tilted to the upside, with higher energy costs, AI-related investment and potential further tariff increases all identified as possible sources of persistent price pressure. Most participants nevertheless left the timing of the next hike open, saying another increase would likely be appropriate by year-end rather than committing specifically to October.
That leaves Gold sensitive not only to Fed expectations but also to what happens at the long end. The 10-year yield has started to meet stronger buying demand around 5.3%, while technically approaching a major 5.413–5.420% resistance cluster. If the yield begins a deeper retreat toward 5.04% or 4.92%, one of Gold’s strongest macro headwinds would ease.
The opposite remains equally important. A decisive break above 5.420% would argue that the yield surge still has further to run, keeping downward pressure on non-yielding Gold.
Dollar Strength Is the Second Gatekeeper
A pullback in Treasury yields alone may not be enough to trigger a durable Gold rebound.
The Dollar remains near an 18-month high, supported partly by continued Euro weakness. That leaves Gold facing two simultaneous headwinds: elevated real yields and a firm Dollar.
The distinction matters for any recovery scenario: lower yields alone could slow or stop the decline in Gold, while lower yields combined with a weaker Dollar would provide a much stronger foundation for a rebound. As long as Dollar strength persists, Gold may continue to struggle even if the Treasury market begins to stabilize.
Gold/Silver Ratio Shows Pressure Is Shifting Toward Silver
The Gold/Silver ratio provides another sign that the character of the precious-metals selloff may be changing.
The ratio has risen to around 69.48, pushing above the previous 69.06 area after its latest pullback held around 67.18. The 55-day EMA near 67.32 also held, while the ratio has moved above the 68.63 resistance area.
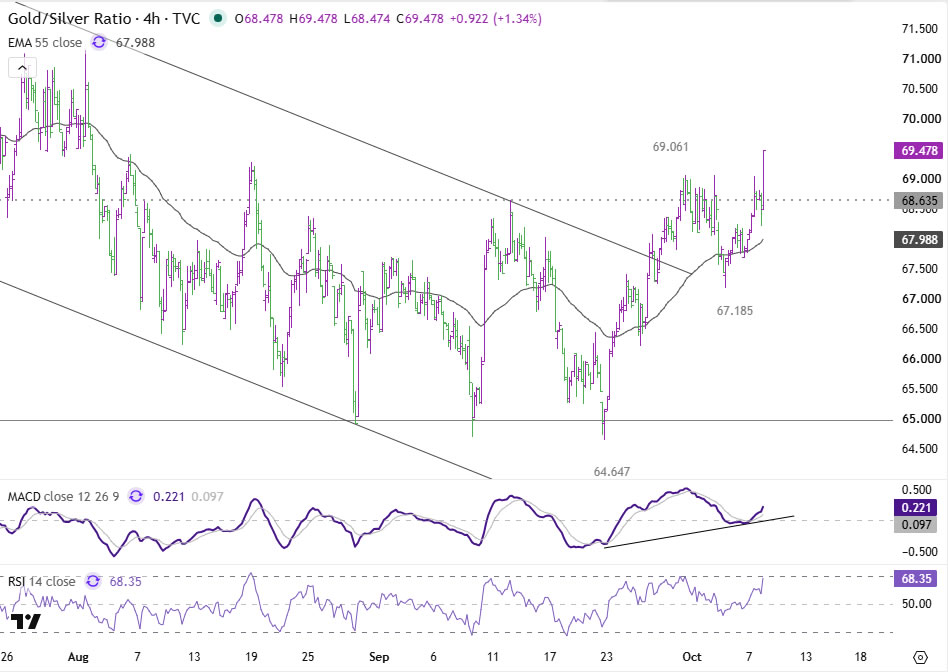
A sustained daily close above 68.63 would strengthen the case that the pullback from 72.554 has ended and put that high back into focus. The near-term bullish ratio structure remains intact while 67.18 holds.
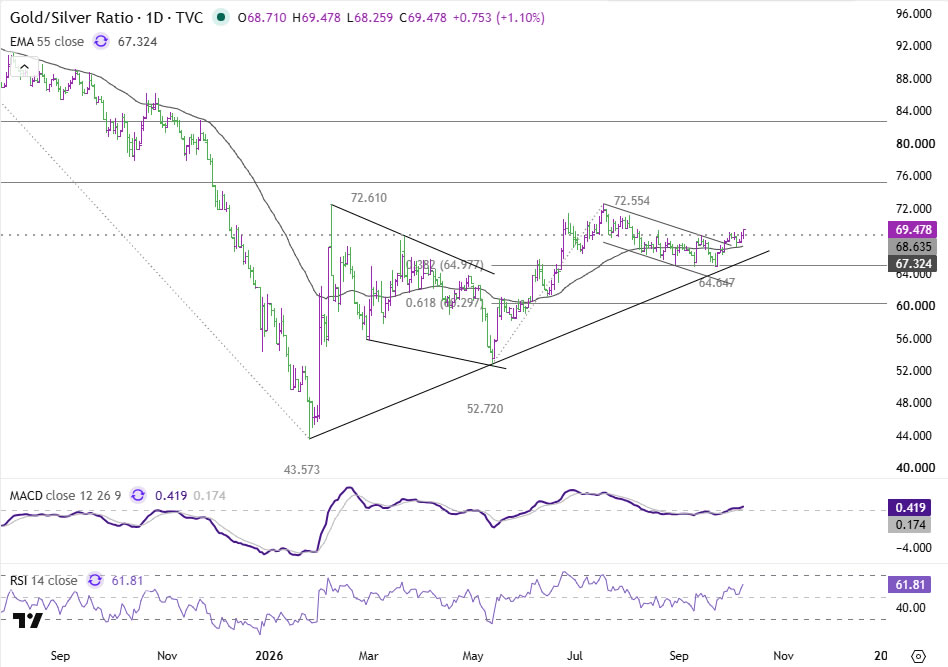
That doesn’t provide a direct Gold buy signal. It instead suggests that selling pressure is increasingly concentrated in Silver, which could help explain why Gold’s downside momentum is beginning to fade even though the broader metals backdrop remains weak.
ActionForex’s Technical View: 3,937–3,942 Is the Real Decision Zone
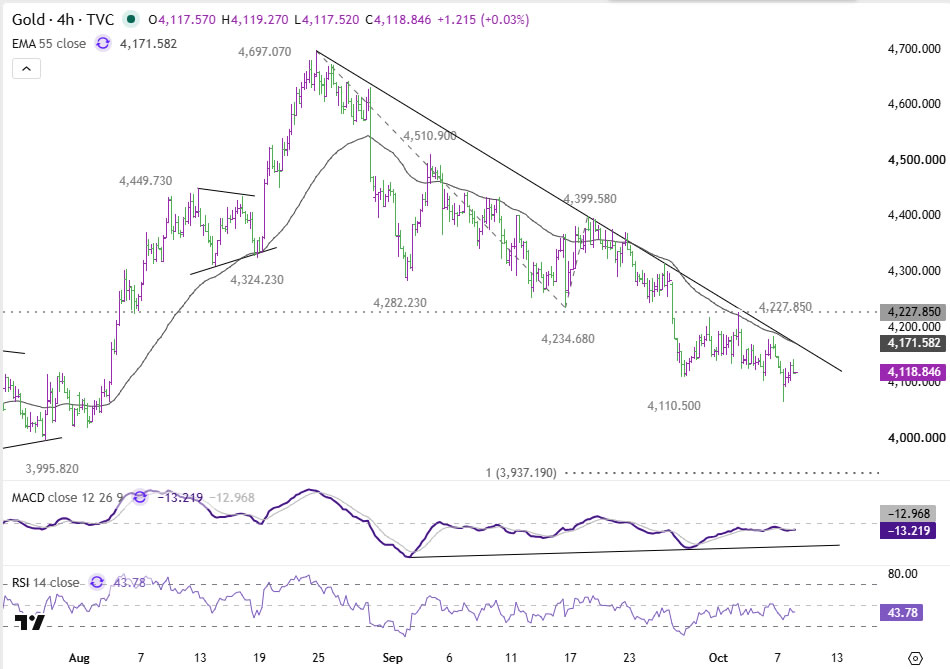
Technically, Gold’s decline from 4,697.07 can be treated as a corrective three-wave structure. The first leg fell to 4,234.68, followed by a rebound to 4,399.58. The current decline forms the third leg, with the 100% equality projection at 3,937.19.
That projection almost exactly overlaps the 3,942.43 July low, creating a narrow and technically significant support cluster at 3,937–3,942. This is more meaningful than the psychological 4,000 level itself—a move below 4,000 would not automatically signal an acceleration in the broader downtrend if Gold stabilizes around the 3,937–3,942 cluster.
Momentum is also beginning to warn that the decline may be entering a late stage. On the 4-hour chart, Gold has made lower lows while MACD has made higher lows, producing bullish divergence. That indicates fading downside momentum, although it does not yet confirm that a bottom has formed.
4,227–4,246 Still Keeps Bears in Control
The immediate technical bias remains bearish while Gold stays below 4,227.85–4,245.68. The first obstacle on any rebound is the 4-hour 55 EMA near 4,171.58, followed by the descending trendline—but clearing those levels would only improve short-term momentum.
A sustained break above 4,245.68 would provide the first stronger indication that the current C-wave decline may have completed. Above there, 4,399.58 becomes the critical invalidation level for the present bearish count. Until those levels are reclaimed, rebounds should still be treated as corrective.
Below 3,937 Would Change the Story
The potential exhaustion zone around 3,937–3,942 only matters if it actually holds. If Gold falls into that region, loses downside momentum and then recovers above 4,245.68, the case for completion of the C-wave would strengthen considerably.
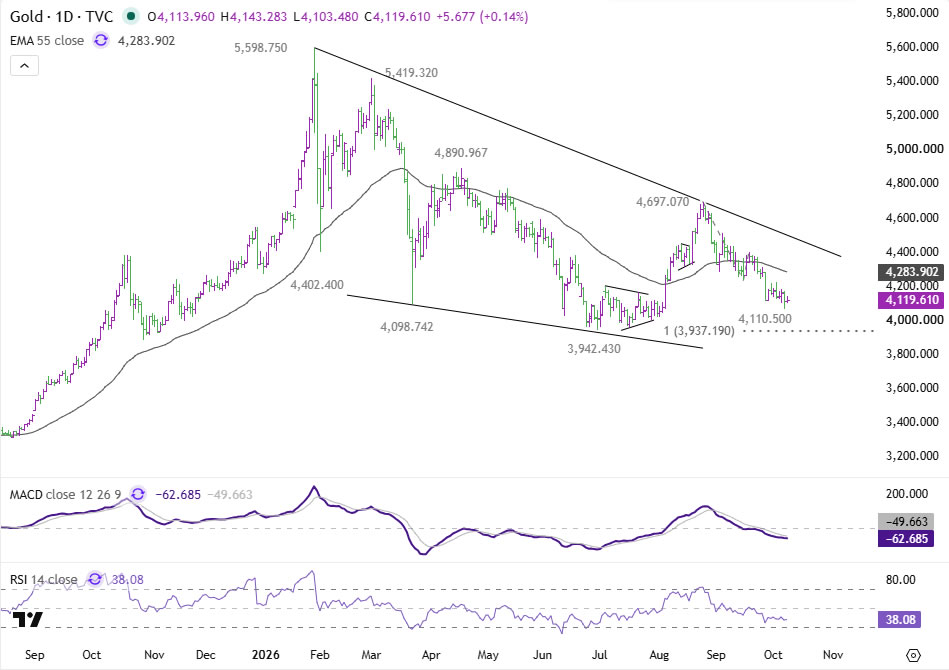
But a sustained break below 3,937.19, together with a failure of the 3,942.43 July low, would instead indicate that the current decline is extending. A sustained break of 3,942.43 would also signal resumption of the broader decline from the 5,598.75 record high.
For now, Gold remains under pressure from real yields and the Dollar. But with downside momentum fading and a major technical cluster approaching just below 4,000, the selloff is entering an area where the balance between continuation and exhaustion could change quickly.
The key question is not simply whether Gold can break 4,000. It is whether the decline can still generate enough momentum to break through 3,937–3,942 once it gets there.
Key Takeaways
- Gold fell to 4,066.21 before recovering toward 4,120, with the near-term bias staying bearish below the 4,227.85–4,245.68 resistance zone.
- Rising real yields and dollar strength remain Gold’s two main headwinds, but the 10-year yield meeting demand near 5.3% and approaching its own 5.413–5.420% resistance raises the chance of a corrective pullback in yields.
- The Gold/Silver ratio’s rise above 68.63 suggests selling pressure within precious metals is shifting toward Silver, helping explain Gold’s fading downside momentum.
- The real technical decision zone is 3,937–3,942—not the psychological 4,000 level—where the current decline’s 100% equality projection overlaps the July low.
- A sustained break below 3,942.43 would signal resumption of the broader decline from the 5,598.75 record high, while a reclaim of 4,245.68 would strengthen the case that the C-wave decline has completed.





