


TL;DR: The US 10-year Treasury yield hit a 24-year high of 5.35% before a strong $39bn auction cleared at 5.30% and pulled heavy demand—evidence that buyers exist near current levels, even as the September FOMC minutes cited AI-related borrowing as a new contributor to rising yields and the technical chart points to a 5.41–5.42% resistance zone as the next real test.
Why This Matters
The 10-year Treasury yield is testing whether the latest leg of its surge has finally reached levels high enough to bring duration buyers back in force. The yield climbed to around 5.35% on Wednesday, its highest in roughly 24 years, before retreating after the $39bn 10-year auction cleared at 5.30%—the highest auction yield since 2000.
Demand was unusually strong, the best since 2016. Indirect bidders took 80.3% of the issue against a 72.4% average, while dealers were left with just 2.5%, well below their usual 9.4% share. The 10-year subsequently pulled back toward 5.29% and is trading around 5.30%. That is meaningful evidence against the most extreme version of the Treasury-supply story: the market is not failing to absorb duration at any price, and at around 5.3%, buyers appeared. But one strong auction is not enough to establish that the term-premium rise has peaked or that 5.3% has become a durable ceiling.
Three Forces Are Still Keeping Yields Elevated
The rise in long-term yields is best understood as three overlapping layers rather than a single Fed story.
The first is monetary policy and inflation. The Fed raised its target range to 3.75–4.00% in September, and the latest FOMC minutes showed most participants still expected another increase by year-end. Oil is also keeping inflation risk elevated, with Brent settling above $100 on Wednesday; the minutes noted that near-term inflation compensation had risen largely with oil, while officials continued to see inflation risks skewed to the upside.
The second layer is term premium and competition for capital. Treasury issuance, large fiscal deficits and uncertainty around the government’s buyback program are all requiring investors to absorb more duration. The US term premium had risen roughly 40bp in two weeks to a 12-year high of 96bp on Monday.
The third layer is the immediate flow of supply and event risk—oil, new corporate borrowing plans and Treasury auctions—which can determine where the next marginal buyer appears even if the larger macro backdrop stays unchanged.
AI Borrowing Has Entered the Fed’s Yield Discussion
The most distinctive development in the September FOMC minutes is that AI-related borrowing has moved into the Fed’s discussion of why longer-term Treasury yields are rising.
The Desk manager cited market commentary pointing to geopolitical developments, uncertainty surrounding Treasury buybacks and competition for capital from heavy private debt issuance used to finance AI infrastructure as contributors to higher term premiums and Treasury yields. A few participants separately mentioned expectations for AI-related borrowing among possible explanations for the rise in long yields.
That marks a step up from July, when AI financing was discussed more as a corporate-credit and financial-stability issue—but the September minutes do not establish AI debt as a dominant Treasury driver. The Fed does not quantify the effect, and the attribution comes partly from market commentary and only a few policymakers. More importantly, the staff’s own decomposition said real rates accounted for most of the rise in longer-maturity Treasury yields, without assigning that rise specifically to AI.
The appropriate conclusion is therefore narrower: AI borrowing has entered the Fed’s explanation set for higher long-term yields, but it has not displaced inflation, Fed policy, Treasury supply or broader term-premium forces as the main story.
The AI Financing Pipeline Is Getting Harder to Ignore
The issue could become more prominent by the October FOMC meeting. Broadcom is reportedly seeking around $50bn of financing, while SpaceX is reported to be considering roughly $30bn of investment-grade debt plus $10bn of loans. Each planned package is of roughly the same order of magnitude as Wednesday’s $39bn Treasury auction.
Reuters has also cited Morgan Stanley estimating more than $3tn of off-balance-sheet AI debt. That estimate shouldn’t be treated as Fed analysis, but it illustrates the scale of private financing that could increasingly compete with sovereign issuance for investor capital.
Crucially, these newer financing headlines arrived after the September FOMC meeting—Wednesday’s minutes could not have incorporated them. The October 27–28 meeting, and the minutes released afterward, will therefore be the better test of whether AI borrowing receives greater weight in the Fed’s interpretation of long-term yields.
Strong Auction Demand Is a Test, Not a Verdict
Wednesday’s auction is the strongest evidence so far that the yield surge is creating its own demand. A 5.30% clearing yield attracted heavy indirect bidding and left dealers with an unusually small share, weakening the argument that Treasury supply is approaching a disorderly choke point. But it does not establish that the equilibrium yield has stopped rising.
The more important question is whether investors will keep absorbing duration at these levels while Treasury issuance, AI-related corporate borrowing, oil-driven inflation uncertainty and a Fed that still expects another hike all compete for capital.
The next test comes with Thursday’s $22bn 30-year auction and Treasury buyback operations in the 20- to 30-year sector. A clean reception would reinforce the idea that current yields are restoring demand; a weak auction would suggest Wednesday’s 10-year result wasn’t enough to settle the broader supply question.
ActionForex’s Technical View: 5.41–5.42% Is the Ceiling to Watch
The technical picture is increasingly stretched, but the 10-year yield has not yet confirmed a top. On the 4-hour chart, the rise from 4.920% can be read as an ending diagonal in a five-wave advance: 4.619% to 4.816%, pullback to 4.732%, advance to 5.041%, correction to 4.920%, and the current fifth leg toward Wednesday’s 5.365% high.
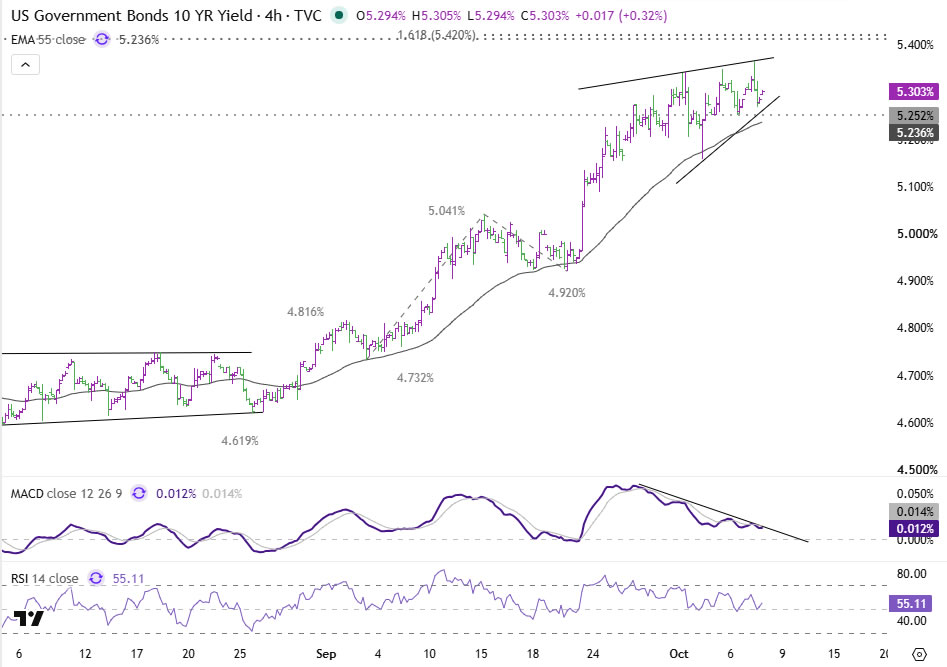
The key resistance cluster sits slightly higher at 5.413–5.420%. The first level is the 138.2% projection of the rise from 3.926% to 4.687% measured from 4.361%; the second is the 161.8% projection of 4.732% to 5.041% measured from 4.920%. Wednesday’s high stopped only around 5bp short of that major projection zone.
Momentum is beginning to warn of exhaustion. 4-hour MACD is showing bearish divergence, while daily RSI is around 72 and starting to roll over, and daily MACD has flattened. But an ending diagonal can still produce a final throw-over—a move through Wednesday’s high toward 5.41–5.42% would remain compatible with a topping structure until that resistance is decisively cleared.
A Break of 5.236–5.252% Would Strengthen the Top Case
The first meaningful downside signal lies around 5.236–5.252%, where the 4-hour 55 EMA converges with nearby swing support. A decisive break—particularly through a fast impulsive decline rather than a slow three-wave pullback—would strengthen the case that the fifth wave has ended, initially pulling the yield toward the 4.920–5.041% support zone, the fourth wave.
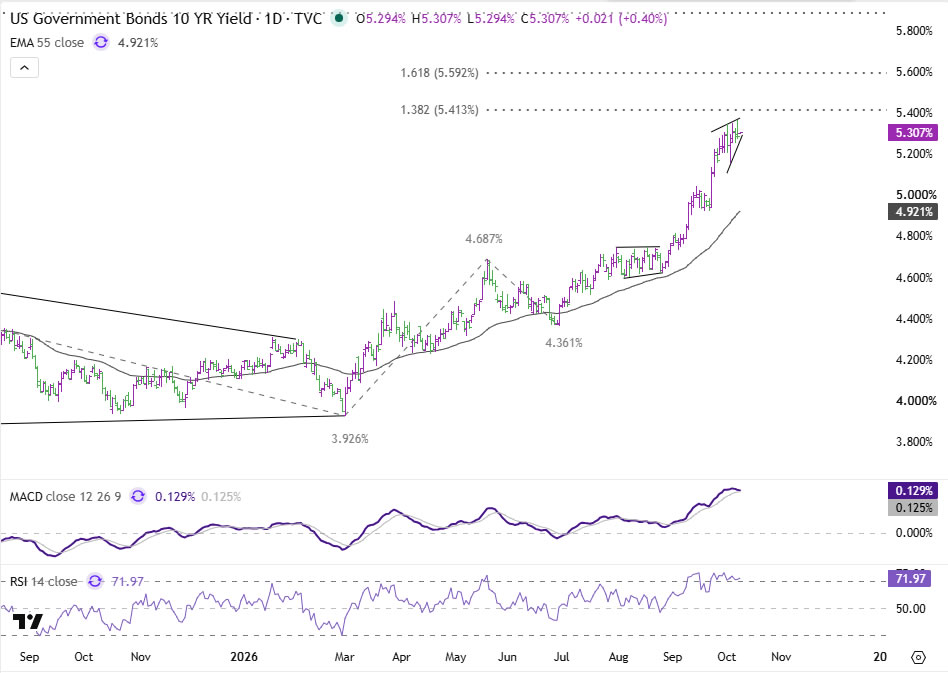
That 4.920% area is particularly important because it also sits almost exactly on the rising daily 55 EMA near 4.921%. A retreat there would still be consistent with a correction inside the broader daily uptrend.
Conversely, a firm break above 5.420%, accompanied by renewed momentum rather than continued bearish divergence, would argue that the current advance is extending rather than topping and would bring the 5.592% projection into focus.
Buyers Have Appeared, But the Supply Test Isn’t Over
Wednesday delivered an important result: 5.3% is high enough to attract serious Treasury demand. What it did not establish is whether that demand is strong enough to absorb the combined pressure from Treasury supply, persistent inflation risk, another potential Fed hike and a rapidly expanding private financing pipeline tied to AI investment.
The technical picture says the same thing: yields are stretched and approaching a major resistance cluster, but the reversal signal is not yet complete.
The 10-year has found buyers. Whether it has found a ceiling will be decided next by the 30-year auction, the 5.41–5.42% resistance zone, and whether the market can break back below 5.236–5.252%.
Key Takeaways
- The 10-year yield hit a 24-year high of 5.35% before a strong $39bn auction cleared at 5.30%, drawing the best demand since 2016 and pushing back against the most extreme supply-crisis narrative.
- Three forces keep yields elevated: Fed policy and oil-driven inflation risk, a rising term premium (96bp, a 12-year high), and immediate supply/event risk from auctions and corporate borrowing.
- September’s FOMC minutes brought AI-related borrowing into the Fed’s yield discussion for the first time as a driver of term premiums—though the Fed’s own data still attributes most of the rise to real rates, not AI.
- Broadcom ($50bn) and SpaceX ($40bn) financing plans, plus Morgan Stanley’s $3tn off-balance-sheet AI debt estimate, arrived after the September meeting and will be tested at the October 27–28 FOMC.
- Technically, 5.41–5.42% is the resistance cluster to watch; a break below 5.236–5.252% would strengthen the case that the yield has topped, while a firm break above 5.420% opens the door to 5.592%.





