


Key Highlights
- Bitcoin failed to clear $87,000 and started a downside correction.
- BTC/USD traded below a triangle support at $85,000 on the 4-hour chart.
- Ethereum also dipped below the $2,680 and $2,620 support levels.
- Gold prices failed to recover and declined further below $4,120.
Bitcoin Price Technical Analysis
Bitcoin price failed to more than two occasions above $86,500 against the US Dollar. BTC started a downside correction below $86,000 and $85,000.
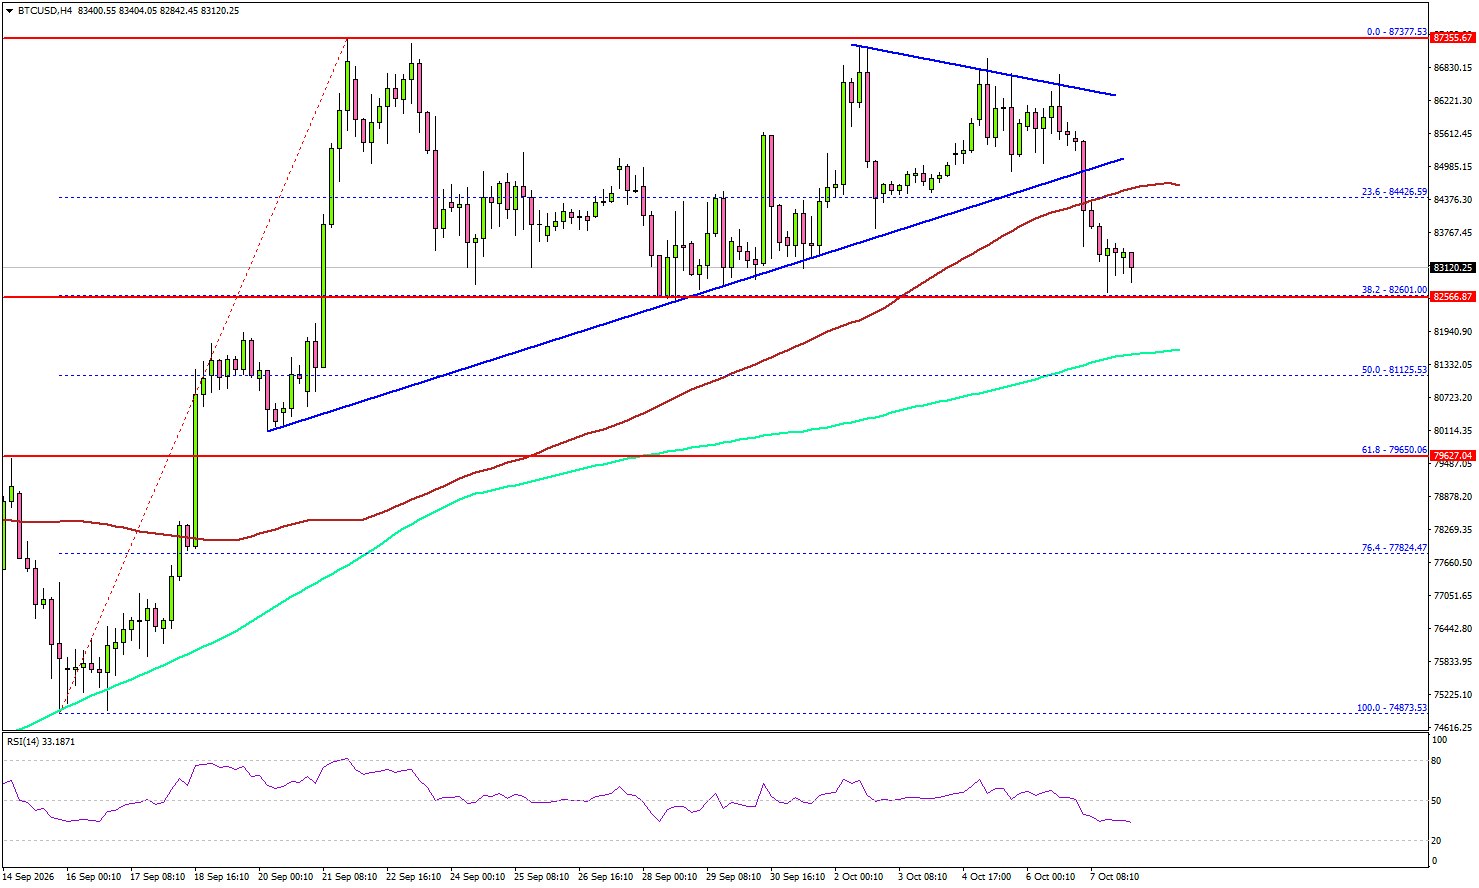
Looking at the 4-hour chart, the price gained bearish momentum after it traded below a triangle support at $85,000. There was a close below $85,000 and the 100 simple moving average (red, 4-hour). If the bears remain in action, the price could revisit the 38.2% Fib retracement level of the upward move from the $74,873 swing low to the 87,377 high at $82,600.
The first major support might be $81,500 and the 200 simple moving average (red, 4-hour). The main base and support could be near the 61.8% Fib retracement at $79,650.
A downside break and close below $79,650 could trigger a sharp decline. In the stated scenario, the price could test $77,800. Conversely, the price could make another attempt to settle above $85,000.
The first major resistance might be $85,500. A close above $85,500 could start another steady increase. In the stated case, the bulls could aim for a move to $87,000. Any further gain might call for a test of $90,000.
Looking at Ethereum, the price failed to settle above $2,750, corrected gains, and might dip further toward the $2,420 support.
Today’s Key Economic Releases
- US Initial Jobless Claims – Forecast 200K, versus 197K previous.
- Fed’s Musalem speech.





