


TL;DR: Last week’s rout across global equities, with Nasdaq’s 10% plunge its worst week since 2020, pulled bond yields down and trimmed expected tightening at all eight major central banks, even though December pricing has held. The central question is whether central banks can keep their hawkish outlooks if the equity correction deepens, which makes equity stabilization the key test for the coming week.
Can Central Banks Stay Hawkish if the Global Equity Rout Deepens?
Global financial markets suffered another week of heavy selling, with Nasdaq Composite plunging 10.02%, S&P 500 losing 8.61% and Dow Jones falling 8.02%. The decline extended across major international equity markets, while government bond yields retreated sharply as investors sought defensive exposure and reduced expectations for future interest rate increases. Yet despite the scale of the equity rout, market pricing for several central banks’ upcoming meetings remained relatively resilient.
The contrast raises an increasingly important question: Can central banks maintain their hawkish policy outlooks if the global equity correction continues to deepen? Markets have already trimmed expected tightening over the coming year across all eight major central banks in the latest OIS comparison. However, the repricing has been concentrated further along the policy horizon rather than consistently overturning expectations for December meetings. Dollar, meanwhile, managed a modest weekly gain as defensive demand partially offset the impact of falling US Treasury yields.
Follow the global equity rout and the central bank repricing on the ActionForex Telegram channel.
Global Equity Rout Deepens as Technology-Heavy Markets Lead Losses
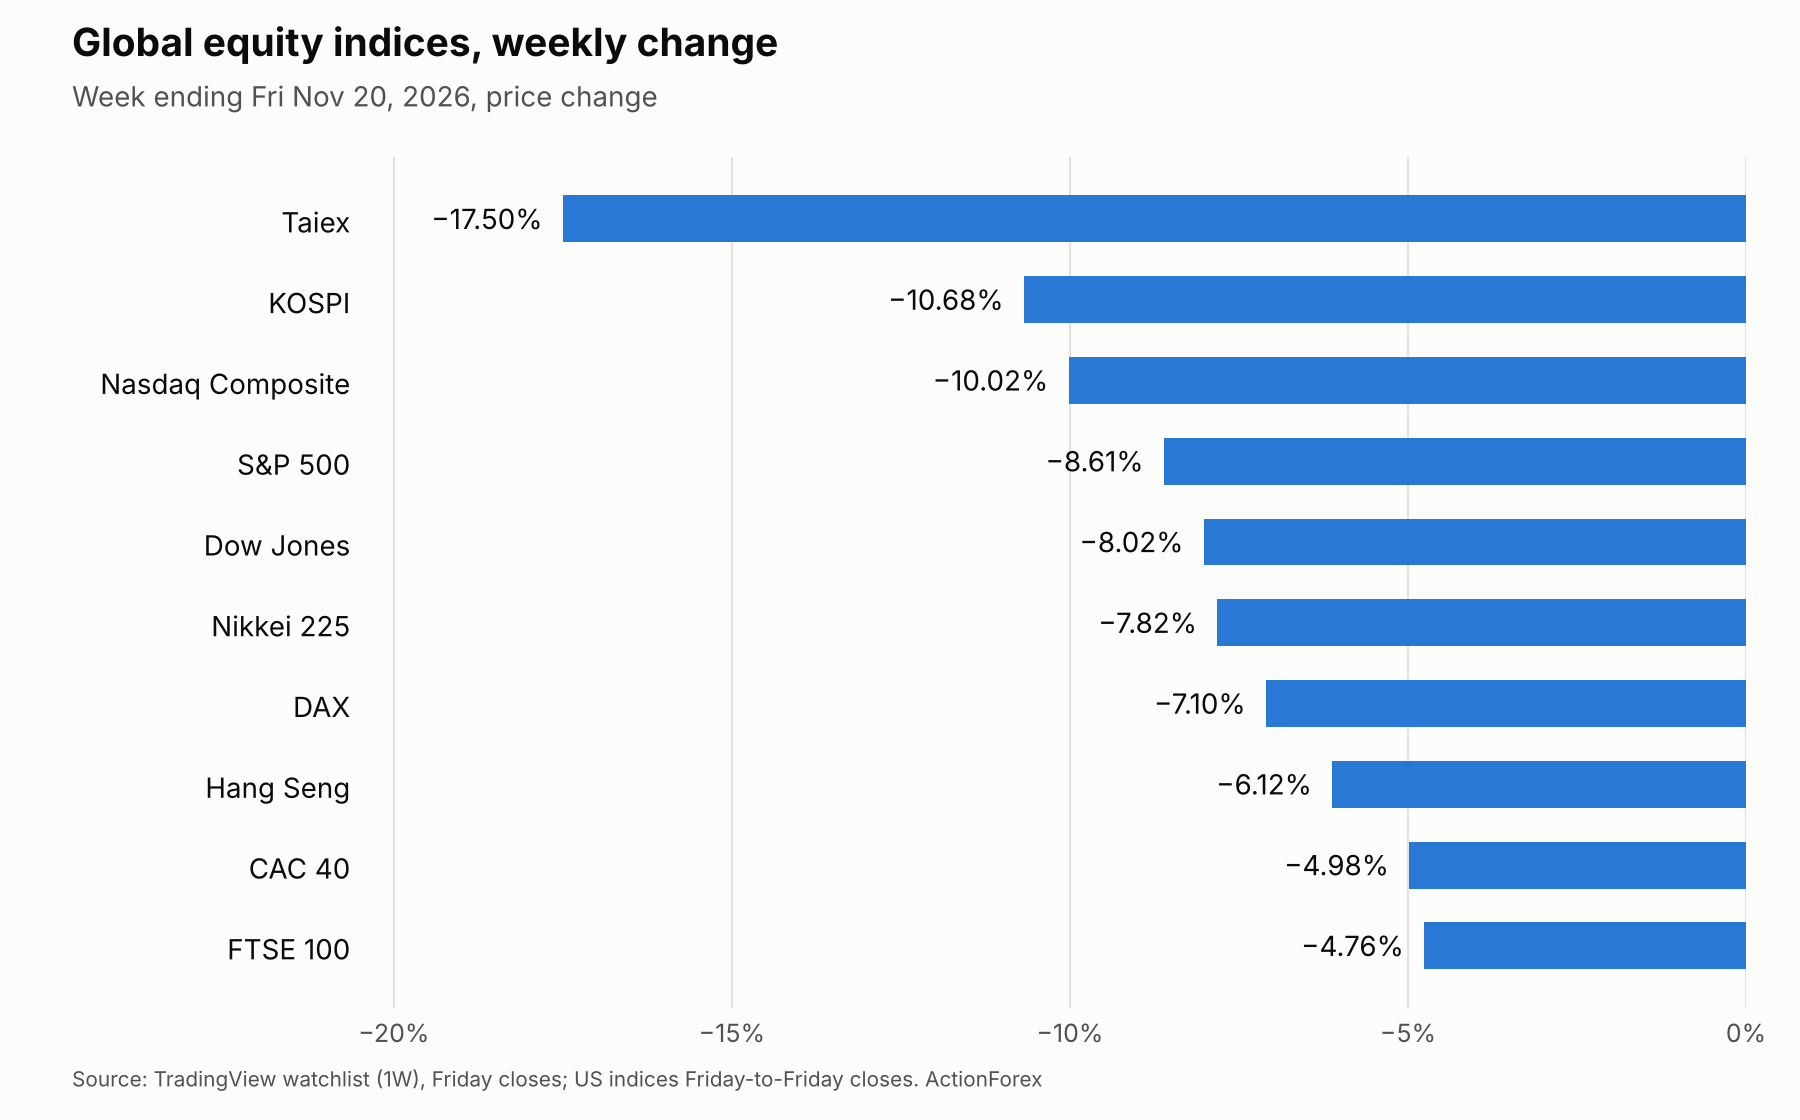
The selloff accelerated dramatically on Friday, with Nasdaq plunging another 5.28%, S&P 500 dropping 3.70% and Dow losing 1.93%. The fresh losses pushed S&P 500 and Dow further into correction territory, while Nasdaq suffered its worst weekly performance since March 2020 and turned negative for 2026. VIX surged to 35.90, its highest closing level since April 2025, reflecting increasingly severe market uncertainty.
The deterioration extended well beyond Wall Street. Taiwan’s Taiex recorded a reported weekly decline of 17.5%, while South Korea’s KOSPI lost 10.68% and Japan’s Nikkei fell 7.82%. European equities also suffered substantial losses, with DAX down 7.10%, CAC 40 losing 4.98% and FTSE 100 falling 4.76%.
- Friday: Nasdaq −5.28%, S&P 500 −3.70%, Dow −1.93%; VIX at 35.90
- Week: Nasdaq −10.02%, S&P 500 −8.61%, Dow −8.02%
- Asia: Taiex about −17.5% (reported), KOSPI −10.68%, Nikkei −7.82%
- Europe: DAX −7.10%, CAC 40 −4.98%, FTSE 100 −4.76%
The particularly steep declines in Taiwan, South Korea and Nasdaq are consistent with the unwinding of positions in markets heavily exposed to AI-related investment and semiconductor demand. Concerns over technology valuations and the prospective returns on enormous AI capital expenditure have increasingly undermined investor confidence. However, the selling has also spread into broader equity markets, suggesting that the correction is no longer confined to the technology sector.
The scale of the decline is becoming more consequential for the wider financial outlook. S&P 500 and Dow are now approximately 12% below their respective record highs, while Nasdaq has retreated more than 18% from its peak. The broadening losses suggest that investors are reassessing equity risk more generally, rather than merely rotating between sectors.
For now, the market evidence points to a substantial reduction in risk exposure, not necessarily an imminent economic contraction. Nevertheless, continued equity losses could tighten financial conditions and eventually influence expectations for monetary policy.
Government Bond Rally Reflects Defensive Demand and Lower Rate Expectations
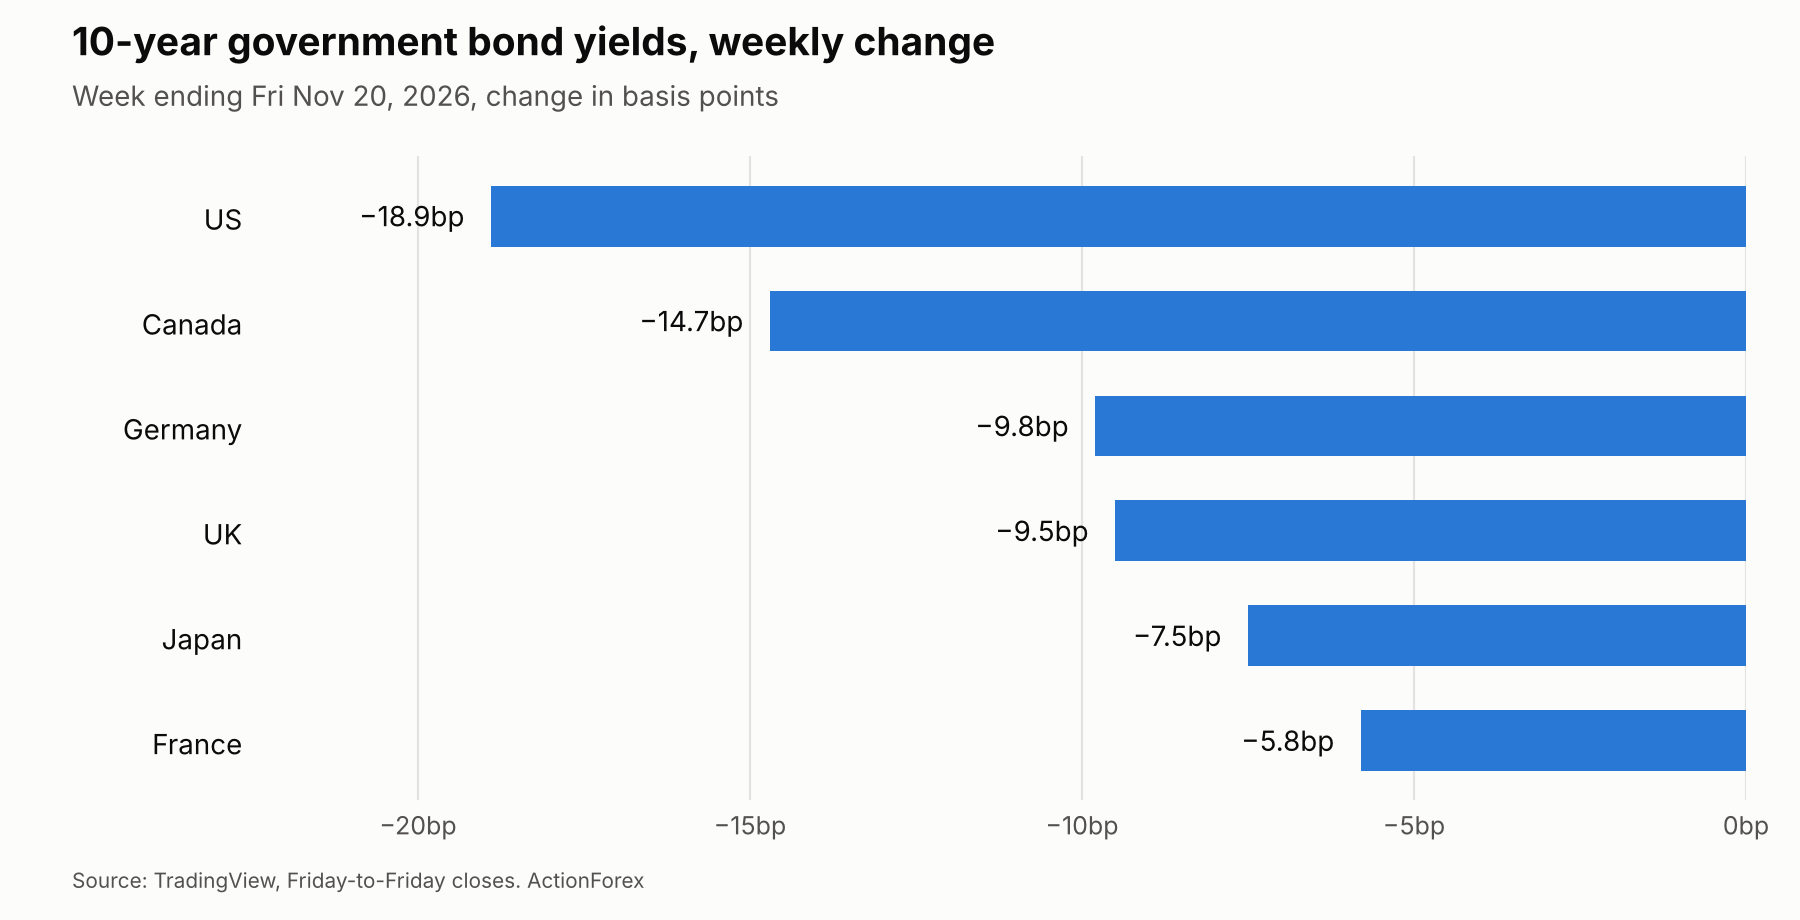
Government bond markets moved in the opposite direction to equities, with yields falling across major economies.
US 10-year Treasury yield declined 18.9bps over the week to 4.950%, including a 10bps drop on Friday alone. Canadian yields fell 14.7bps, while yields in Germany, Britain, Japan and France also registered substantial weekly declines.
The synchronized rally in government bonds reflects two potentially reinforcing forces.
- First, the sharp deterioration in equity markets has increased demand for relatively defensive assets. Government bonds have benefited as investors reduce exposure to stocks and other risk-sensitive holdings.
- Second, markets have begun reassessing the extent of monetary tightening likely to be delivered over the coming year. Lower expected policy rates also provide support for government bonds and contribute to declining yields.
The distinction matters because the bond rally cannot be attributed exclusively to safe-haven demand. The reduction in expected central bank tightening is directly observable in interest rate pricing, although the available evidence does not establish how much of the yield decline resulted from policy repricing rather than defensive buying.
The implication is nevertheless significant: the equity correction is now unfolding alongside a broad adjustment in the market’s interest rate outlook.
Central Bank Pricing Holds for December, but the Longer-Term Path Softens
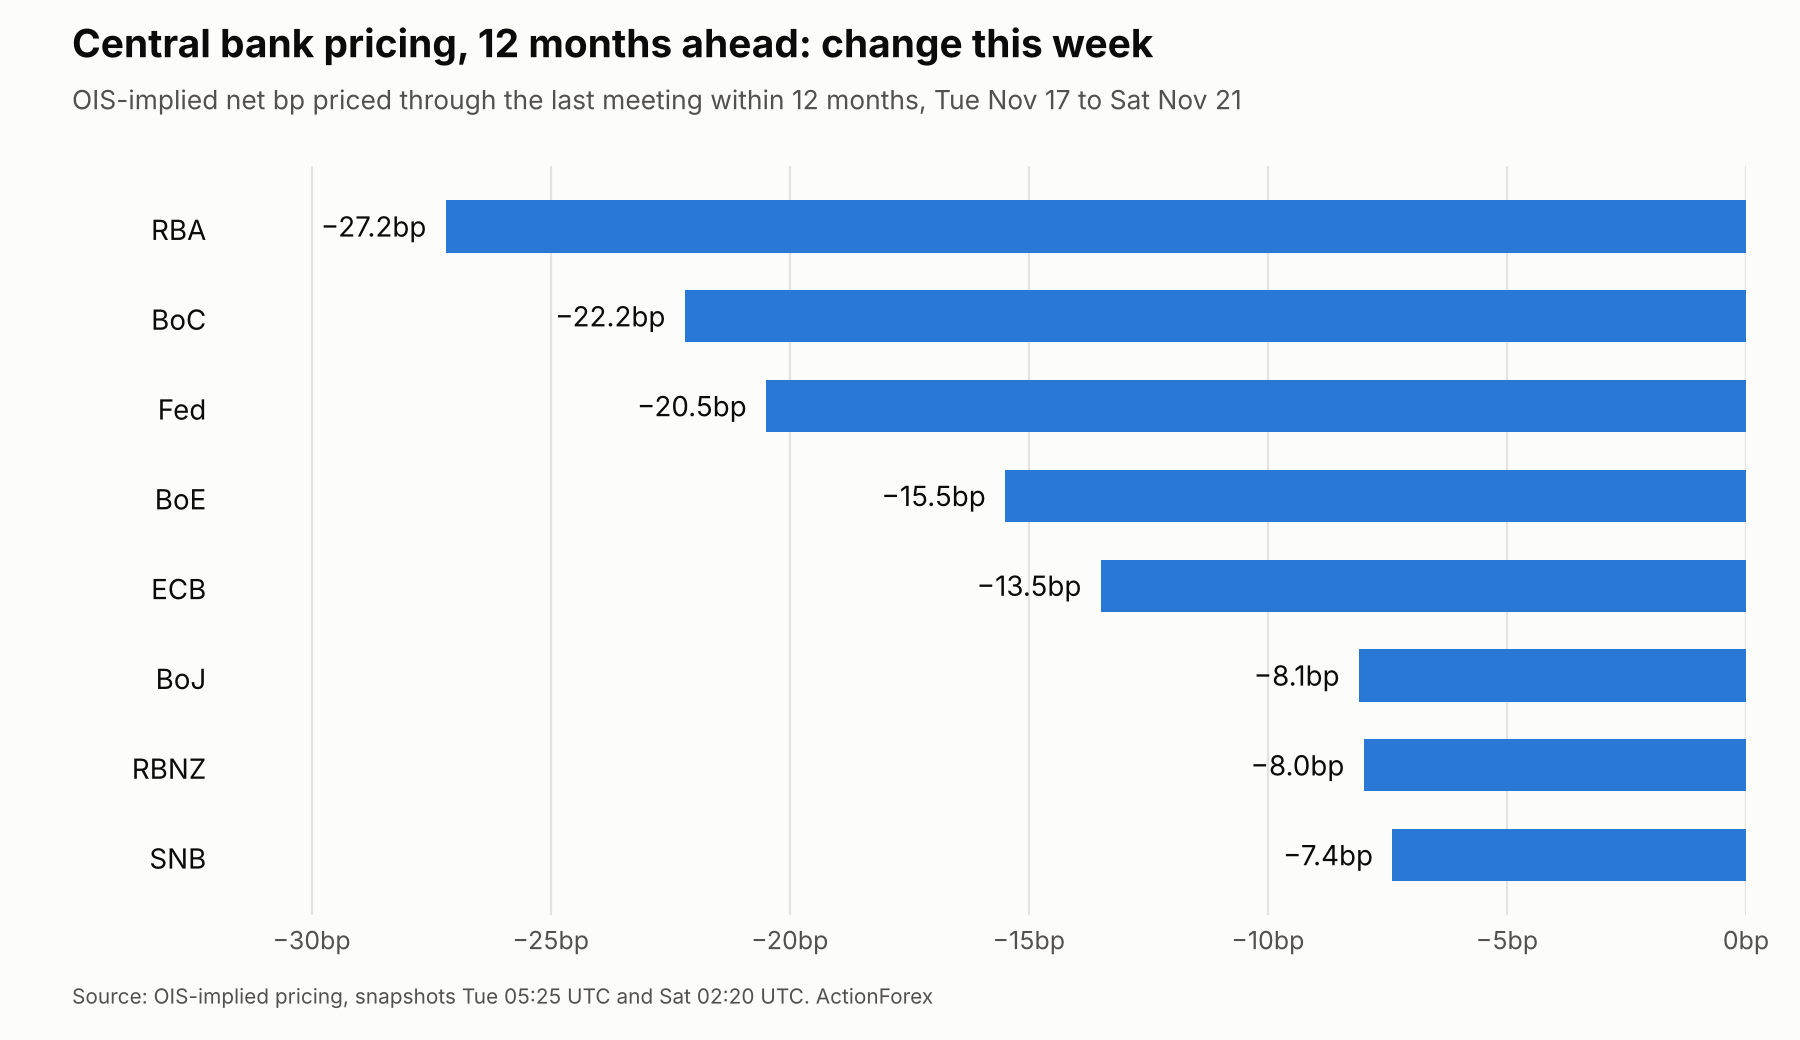
The most revealing development is the divergence between relatively stable expectations for upcoming policy meetings and the substantial reduction in projected tightening over the following 12 months.
December pricing remained comparatively resilient for several central banks. OIS-implied pricing indicated approximately 22.8bps of tightening for ECB’s December meeting, 18.9bps for BoE and 21.3bps for RBNZ. These readings changed little during the latter part of the week.
BoJ’s December pricing eased to around 19.4bps, while BoC pricing declined more noticeably to approximately 11.6bps. RBA pricing continued to reflect a different outlook, with roughly 1bp of easing implied for its December meeting.
- ECB: about 22.8bps of tightening priced for December; BoE: 18.9bps; RBNZ: 21.3bps
- BoJ: about 19.4bps; BoC: about 11.6bps; RBA: roughly 1bp of easing
The broader policy horizon tells a more cautious story.
Between Tuesday’s and Saturday’s OIS snapshots, the amount of net tightening priced over the next 12 months fell across all eight central banks in the comparison. RBA experienced the largest adjustment at 27.2bps, followed by BoC at 22.2bps and Fed at 20.5bps. Expectations were also reduced for BoE, ECB, BoJ, RBNZ and SNB.
- 12-month tightening priced: RBA −27.2bps, BoC −22.2bps, Fed −20.5bps
- Also reduced: BoE, ECB, BoJ, RBNZ and SNB
The repricing was not driven solely by Friday’s equity losses. Australia’s adjustment, for example, was heavily influenced by weaker employment data released earlier in the week. Nevertheless, the continued reduction in expected tightening as equities deteriorated suggests that markets are becoming increasingly sensitive to the implications of financial conditions for future policy decisions.
The contrast with recent central bank communications is striking.
Minutes of the October FOMC meeting showed that almost all participants considered further rate increases likely appropriate. Some participants also indicated that a larger increase could be considered if inflation developments proved unfavorable.
For Fed, this leaves two competing considerations. Inflation concerns continue to support further tightening, but a prolonged deterioration in equity markets and financial conditions could eventually challenge the extent of increases investors expect policymakers to deliver.
The current repricing should not be mistaken for an imminent shift toward monetary easing. Most of the forward curves still anticipate additional tightening. What has changed is the amount of tightening expected over a longer horizon.
This is also not exclusively a Fed development. Similar adjustments across other major central banks indicate that markets are reassessing the balance between persistent inflation pressures and the risks associated with tightening into a weaker financial environment.
Dollar Holds Weekly Gains as Competing Forces Offset Each Other
Dollar’s performance was notably resilient considering the decline in US Treasury yields.
Dollar Index ended the week at 103.840, up 0.42%, although most of that gain had already been achieved before Friday. The index subsequently edged down 0.08% as the equity rout intensified and US 10-year yield fell another 10bps.
On the weekly FX heat map, Yen emerged as the strongest major currency, outperforming all seven peers. Dollar ranked second, while Australian Dollar was the weakest.
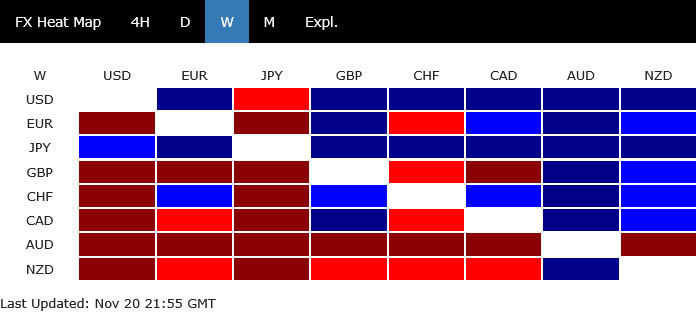
The pattern illustrates the competing forces affecting Dollar.
Global risk aversion continued to provide some defensive support, helping the currency retain most of its earlier gains. However, falling US yields and reduced expectations for future Fed tightening weakened the interest rate advantage that had supported its advance.
US 10-year yields fell more than those of the other major economies in the supplied comparison, narrowing yield differentials against Dollar. Yet the currency continued to outperform most peers, suggesting that interest rate considerations alone were insufficient to explain its resilience.
Yen’s stronger performance was consistent with both defensive demand and a narrower US-Japan yield differential. The weakness in Australian Dollar, meanwhile, reflected its greater sensitivity to global risk sentiment alongside the domestic repricing following disappointing Australian employment figures.
The broader lesson is that risk aversion does not necessarily translate into an accelerating Dollar rally when US yields are falling and Fed tightening expectations are being reduced.
The Coming Week: Equity Stabilization Becomes the Central Test
The immediate question is whether global equities can stabilize following the latest wave of selling.
A sustained recovery in stocks would likely reduce some defensive demand for government bonds and could allow yields to rebound. With central banks still emphasizing inflation risks, stabilization would also make it easier for markets to maintain expectations for further tightening.
Conversely, another sharp deterioration in equities could deepen the reduction in expected policy rates, particularly beyond the upcoming meetings. Government bonds might attract additional defensive demand, while Yen could continue outperforming other currencies.
Dollar’s response would remain less straightforward. A worsening equity selloff could strengthen its defensive appeal, but further declines in US yields would continue to undermine its interest rate support.
The coming week’s flash PMI releases, US PCE inflation figures and Fed communications will provide additional information, although the trajectory of equity markets may be equally important in shaping market expectations.
For now, the central policy tension remains unresolved: officials continue to signal further tightening, while financial markets are becoming less confident that the full anticipated path can be sustained if the equity correction deepens.
S&P 500 Technical Outlook: Larger Correction Targets 6,147–6,182 Support
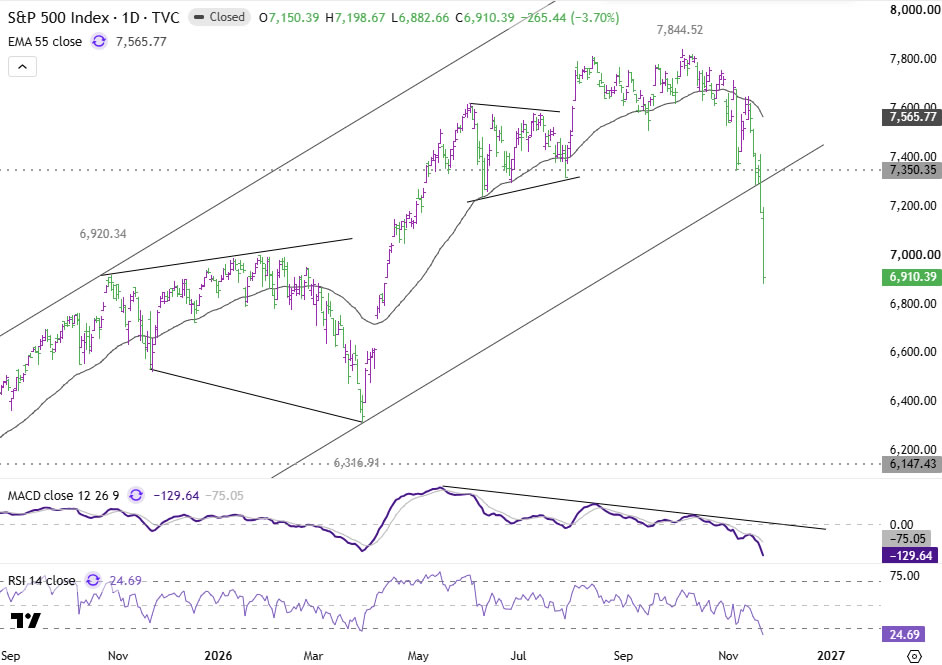
S&P 500’s selloff intensified sharply last week, decisively breaking below the support line of its medium-term rising channel.
Daily RSI has fallen deep into oversold territory, but there is still no clear indication that the decline is approaching a durable bottom.
Even if a recovery develops, risks will remain heavily skewed toward the downside as long as 7,350.35 support-turned-resistance holds.
The immediate question is where S&P 500 can attract sufficient buying interest to establish a sustainable rebound rather than merely a temporary oversold recovery.
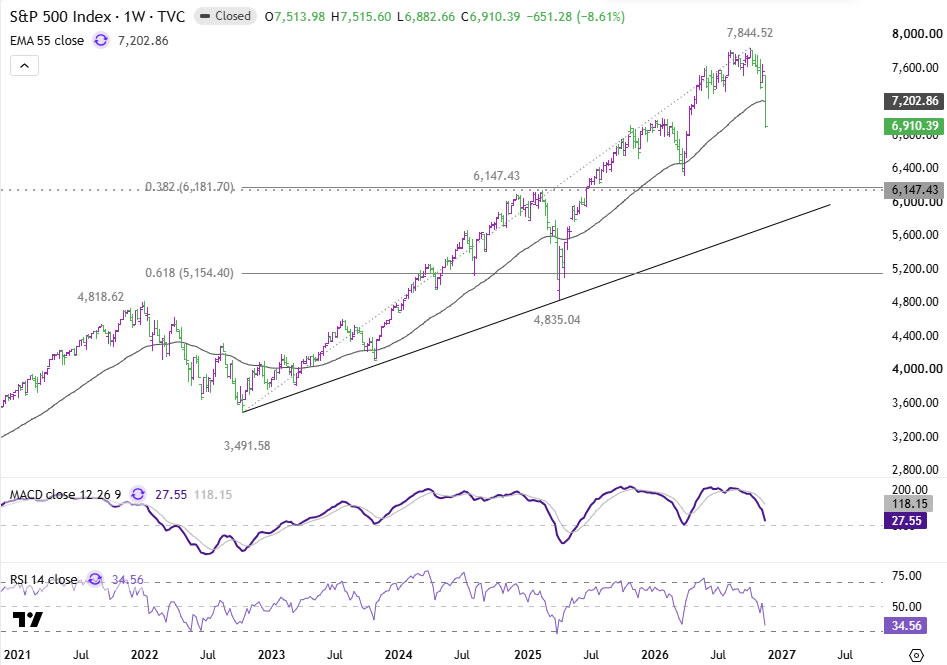
On the weekly chart, the decisive break below the 55-week EMA, currently around 7,203, indicates a more significant deterioration in the medium-term outlook.
The fall from the record high at 7,844.52 is now tentatively seen as correcting the broader uptrend from the 2022 low at 3,491.58.
If that interpretation is correct, there is room for further decline toward the 6,147.43 cluster support, close to the 38.2% retracement of the entire advance at 6,181.69.
This area could provide a more meaningful foundation for a rebound, although the current technical picture offers little confirmation that selling pressure has already exhausted itself.
Nasdaq Technical Outlook: Risk Extends Toward 20,690 and Potentially Below 20,000
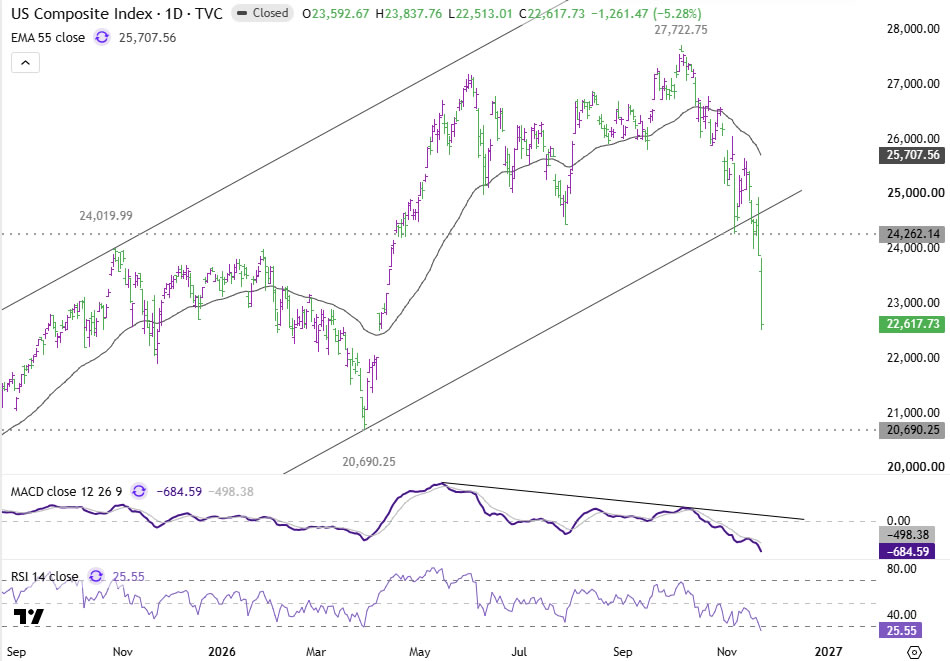
Nasdaq’s technical deterioration is even more pronounced following the sharp acceleration of the decline from 27,722.75.
The index has moved decisively away from its medium-term rising channel, confirming that downward momentum has strengthened considerably.
Daily RSI is deeply oversold, but there is no convincing sign of bottoming yet.
Even if an interim rebound develops, downside risks will remain dominant as long as 24,262.14 support-turned-resistance holds.
The central question is where Nasdaq will find sufficiently strong support to form a durable bottom and support a sustained recovery.
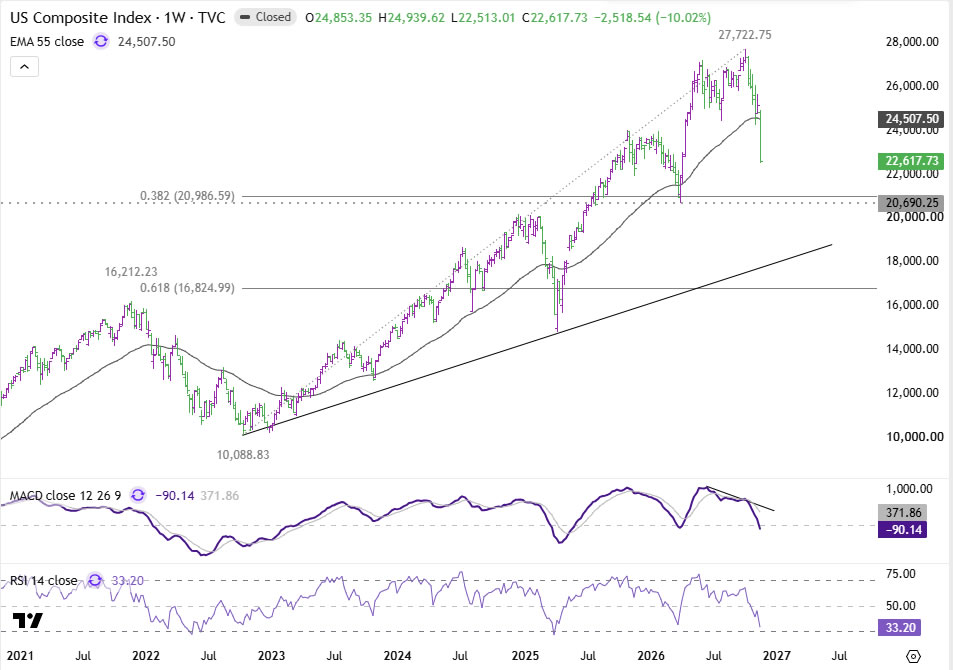
The weekly chart reinforces the bearish outlook.
The decisive break below the 55-week EMA, currently around 24,508, suggests that the fall from 27,722.75 is correcting the broader uptrend originating from the 2022 low at 10,088.83.
There is room for the selloff to extend toward 20,690.25 cluster support, near the 38.2% retracement at 20,986.59, before attracting more substantial buying interest.
However, Nasdaq’s relatively high volatility among the major US indexes means a deeper decline cannot be ruled out.
In particular, a move below the psychological 20,000 level toward the long-term rising trendline would not be surprising if the broader market correction continues before stabilizing.
US 10-Year Treasury Yield: 4.814% Holds the Key to the Bond Rally
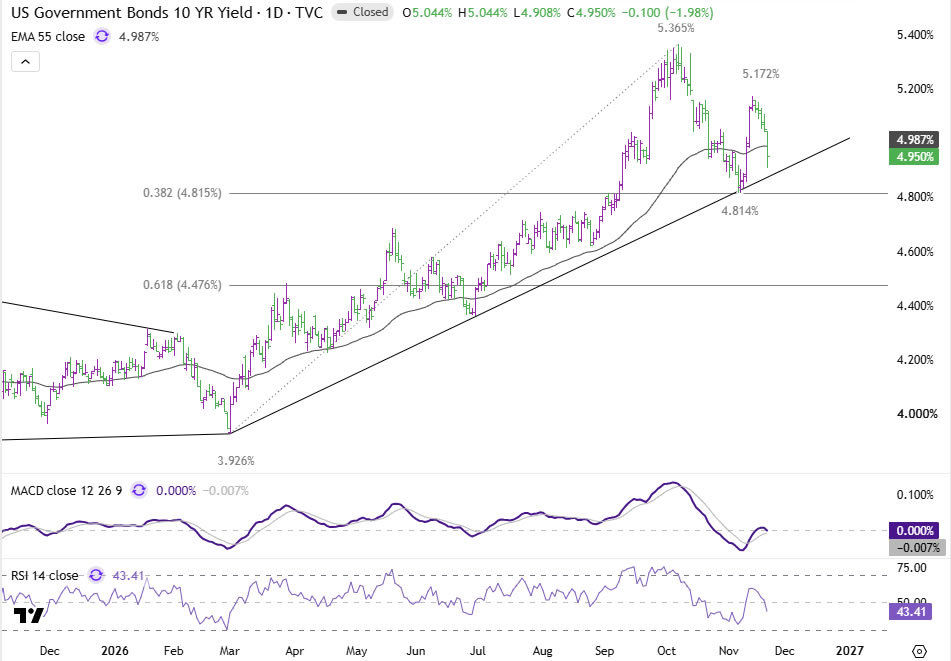
Despite Friday’s substantial decline, US 10-year Treasury yield remains above the important 4.814% cluster support, close to the 38.2% retracement of the advance from 3.926% to 5.365%.
Price action from 5.365% is still interpreted as potentially developing into a sideways consolidation pattern rather than a confirmed reversal of the entire preceding advance.
Under this scenario, further near-term declines should find support around 4.814%, bringing a recovery in yields. A break above 5.172% resistance would reinforce the consolidation interpretation and reopen the way toward 5.365%.
However, a sustained break below 4.814% would suggest that the fall from 5.365% is developing into a deeper reversal of the rise from 3.926%.
That would expose the 61.8% retracement around 4.475%.
More importantly, a rapid decline accompanied by further downside acceleration would raise concerns that investors are intensifying their shift from risk assets into Treasuries. Such a development would warrant close attention, although yield movements alone cannot establish the scale or precise cause of any liquidation.
Dollar Index Technical Outlook: Bullish Structure Intact Despite Slowing Momentum
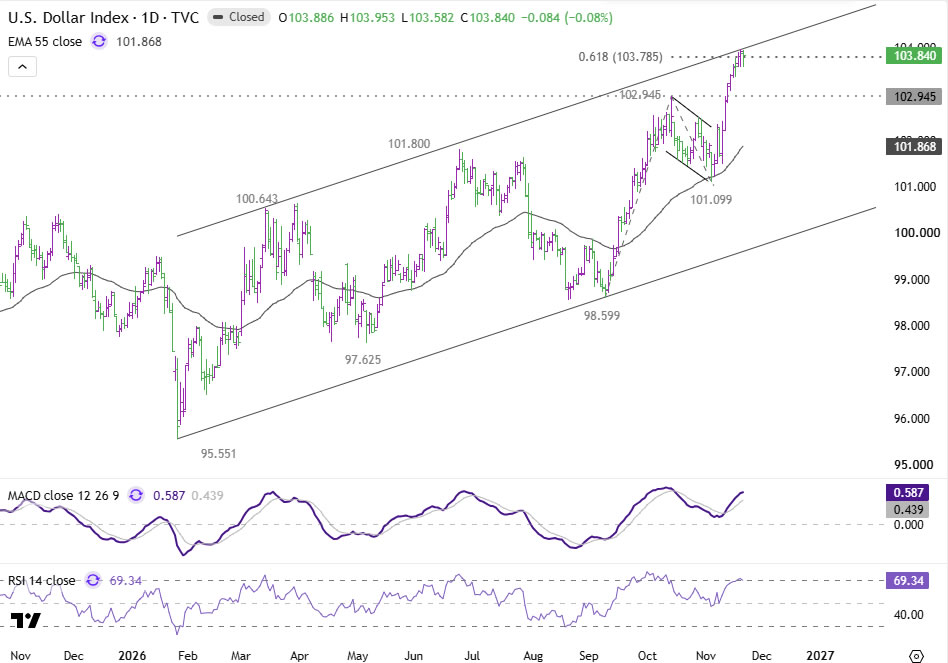
Dollar Index edged higher last week but struggled to generate strong follow-through.
Part of the hesitation can be attributed to stretched momentum following an earlier overbought reading in daily RSI.
Resistance is also emerging around the 61.8% projection of 98.59 to 102.94 from 101.09 at 103.78, together with the ceiling of the medium-term rising channel.
A near-term pullback may therefore be due.
Nevertheless, the outlook will remain bullish as long as 102.94 resistance-turned-support holds.
Sustained trading above 103.78 and the channel ceiling would pave the way toward the 100% projection at 105.44.
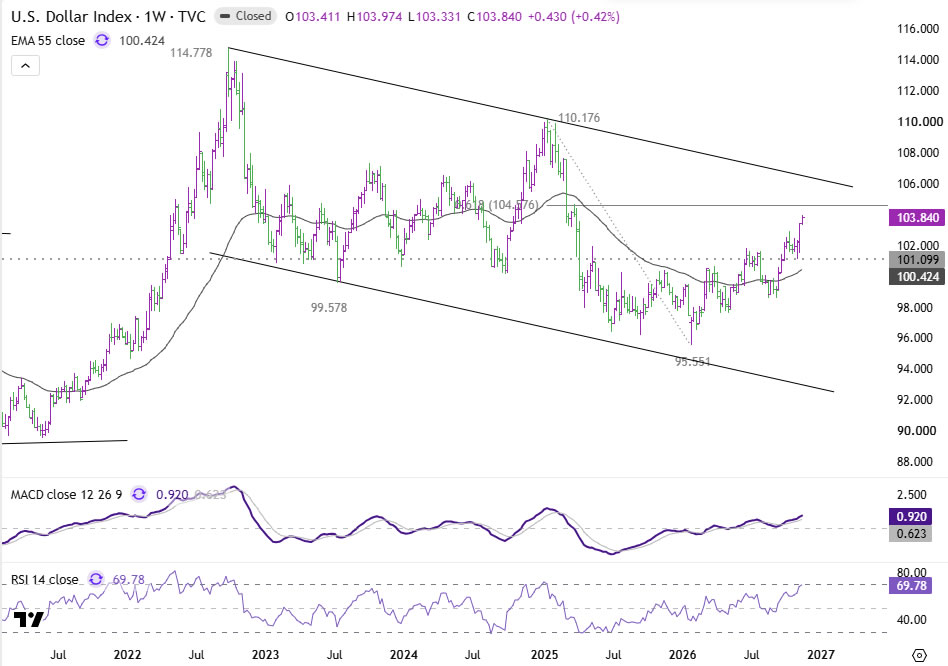
On the weekly chart, the rise from the 2026 low at 95.55 remains intact as long as 101.09 support holds.
The next major objective is the 61.8% retracement of the decline from 110.17 to 95.55, around 104.58.
A firm break above that level would expose the ceiling of the long-term falling channel, currently around 106.5.
The reaction from this resistance area would be particularly important in determining whether the longer-term correction from the 2022 high at 114.77 has already completed at 95.55, or whether another downward leg remains possible.
For now, Dollar’s broader technical outlook remains constructive despite the hesitation seen toward the end of the week. Whether that strength can extend will depend partly on the balance between defensive currency demand and the continued decline in US yields.
Key Takeaways
- Nasdaq fell 10.02% on the week (its worst since March 2020), S&P 500 8.61% and Dow 8.02%, with VIX closing at 35.90 and the selling spreading across Asia and Europe.
- US 10-year yield fell 18.9bps to 4.950%, and the net tightening priced over 12 months fell at all eight central banks (RBA −27.2bps, BoC −22.2bps, Fed −20.5bps), while December pricing stayed resilient.
- Dollar Index still gained 0.42% to 103.840 as defensive demand offset lower yields, while Yen was the strongest major currency and Australian Dollar the weakest.
- S&P 500 targets 6,147–6,182 support and Nasdaq 20,690–20,987, with 7,350.35 and 24,262.14 as the resistance levels for the bearish view.
- US 10-year yield support is 4.814% and the Dollar Index outlook stays bullish above 102.94, while equity stabilization, flash PMIs, US PCE and Fed communications are the next tests.
Stay ahead of the equity rout and the central bank repricing it could drive—join the ActionForex Telegram channel for regular market updates and analysis.